Open Access
Fig. B.7
Download original image
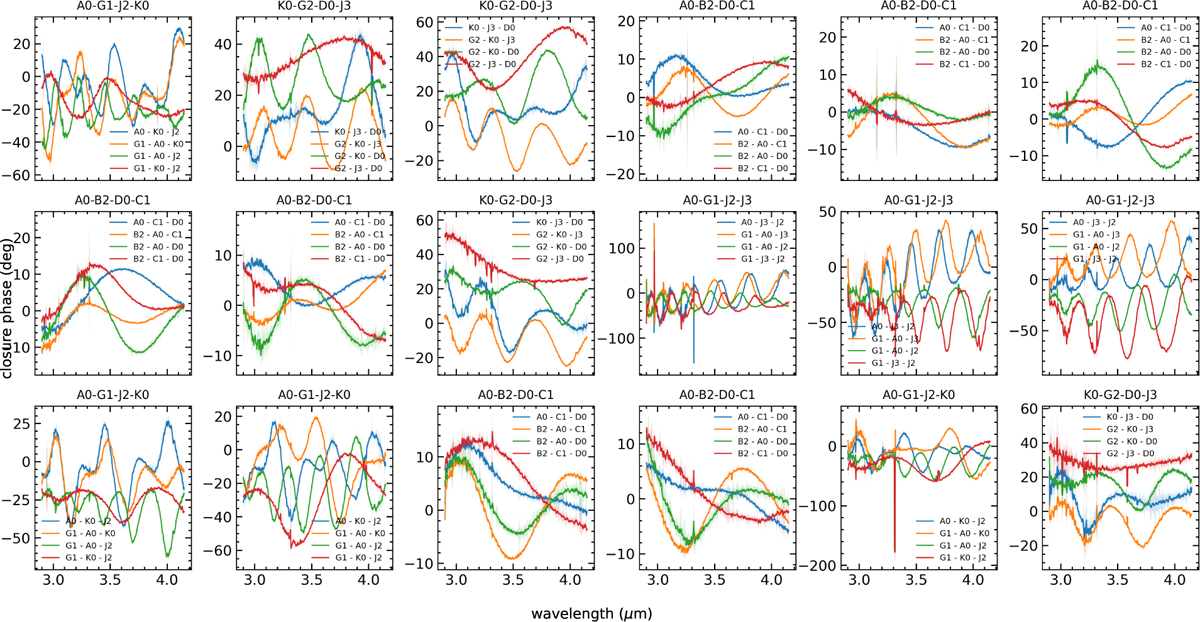
MATISSE L-band closure phases from the imaging data. These are color-coded per baseline triangle as shown in each panel. Each panel is sequentially ordered as in Fig. B.1.
Current usage metrics show cumulative count of Article Views (full-text article views including HTML views, PDF and ePub downloads, according to the available data) and Abstracts Views on Vision4Press platform.
Data correspond to usage on the plateform after 2015. The current usage metrics is available 48-96 hours after online publication and is updated daily on week days.
Initial download of the metrics may take a while.