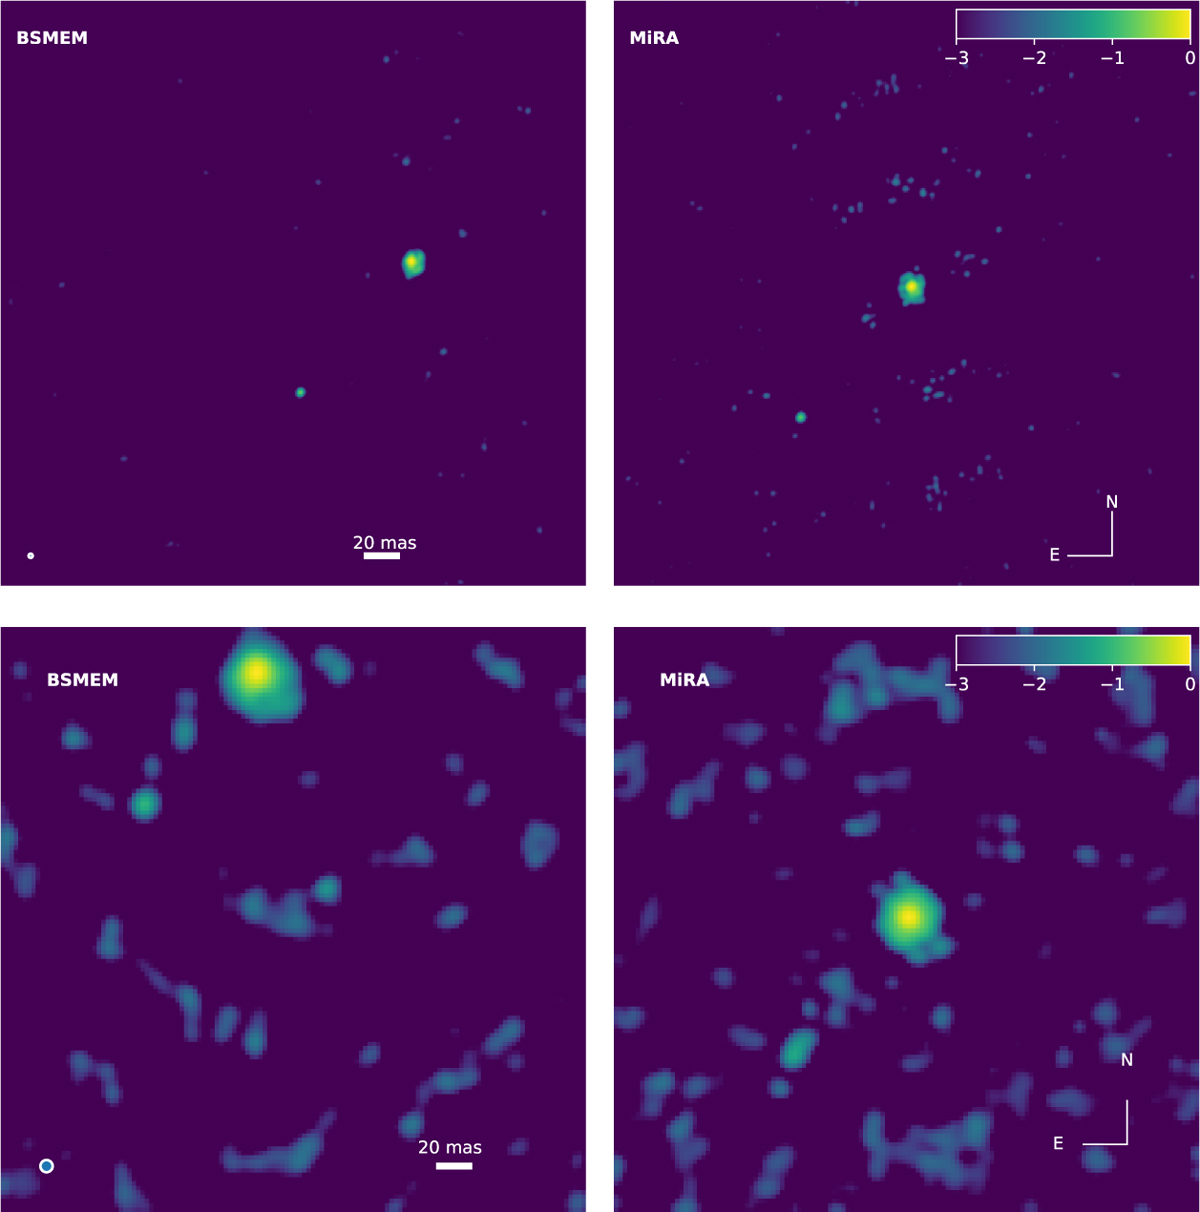
Fig. C.1
Download original image
Comparison between BSMEM (left) and MiRA (right) reconstructions at 3.5μm (top row) and 8.5μm (bottom row). Each reconstruction image is normalized to the peak intensity, and scaled in a logarithmic stretch to a minimum level of 10−3 as indicated in the colorbar. The FOV is 400 × 400 mas with north up and east toward left. The theoretical MATISSE beam is shown as a white circle in the lower-left corner of the left panels. A Gaussian smoothing with a FWHM equal to the beam has been applied throughout to enhance the FUor’s disk.
Current usage metrics show cumulative count of Article Views (full-text article views including HTML views, PDF and ePub downloads, according to the available data) and Abstracts Views on Vision4Press platform.
Data correspond to usage on the plateform after 2015. The current usage metrics is available 48-96 hours after online publication and is updated daily on week days.
Initial download of the metrics may take a while.