Open Access
Fig. D.1
Download original image
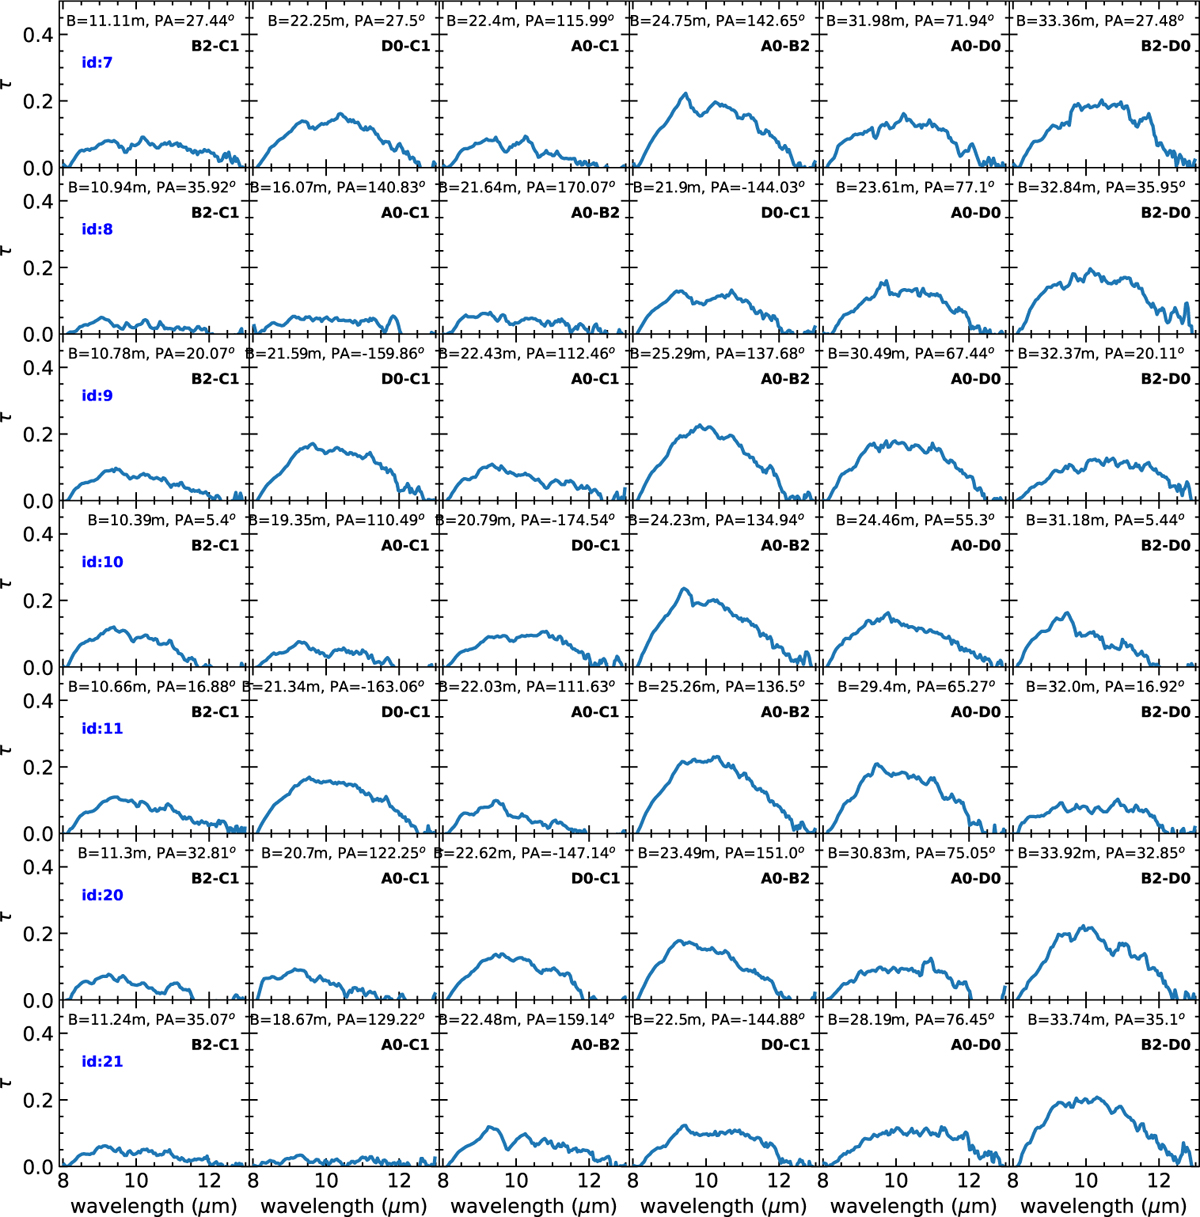
Optical depth (τ) per baseline. The details of each baseline name, projected length and position angle, are stated within each panel. Each row corresponds to a different small-array observation and their ids (blue) can be found in Table B.1.
Current usage metrics show cumulative count of Article Views (full-text article views including HTML views, PDF and ePub downloads, according to the available data) and Abstracts Views on Vision4Press platform.
Data correspond to usage on the plateform after 2015. The current usage metrics is available 48-96 hours after online publication and is updated daily on week days.
Initial download of the metrics may take a while.