Fig. 3
Download original image
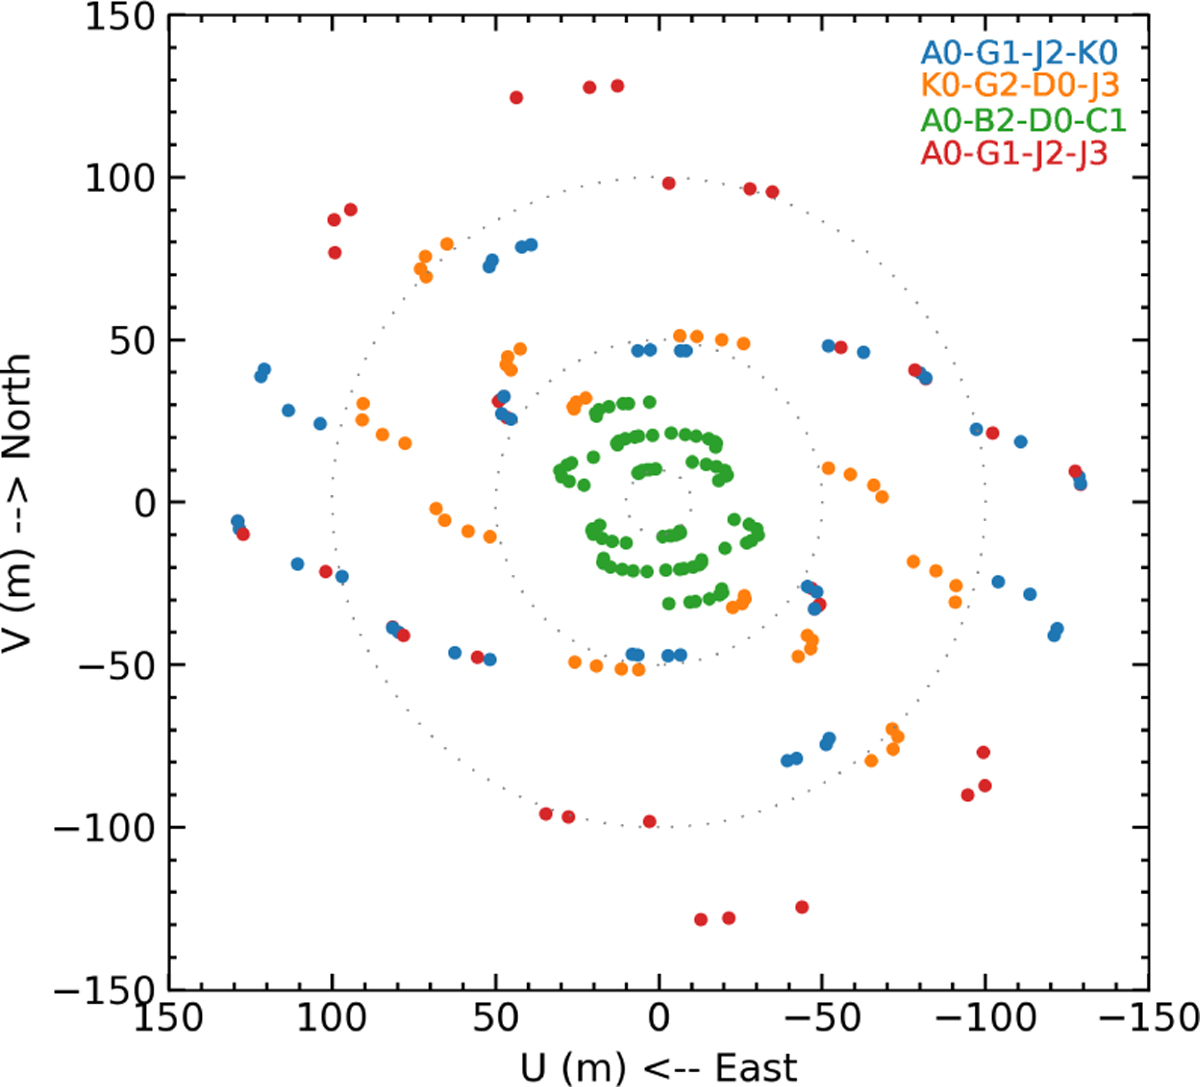
MATISSE uv-plane coverage of “imaging” mode observations of Z CMa during its outburst phase. The uv coordinates are colored per respective VLTI configuration array as in Table B.1; that is, the small array included the A0-B2-D0-C1 quadruple, the medium array included the K0-G2-D0-J3 quadruple, and the large included the A0-G1-J2-K0 quadruple, which was interchanged with the A0-G1-J2-J3 to maximize uv coverage.
Current usage metrics show cumulative count of Article Views (full-text article views including HTML views, PDF and ePub downloads, according to the available data) and Abstracts Views on Vision4Press platform.
Data correspond to usage on the plateform after 2015. The current usage metrics is available 48-96 hours after online publication and is updated daily on week days.
Initial download of the metrics may take a while.