Fig. 4
Download original image
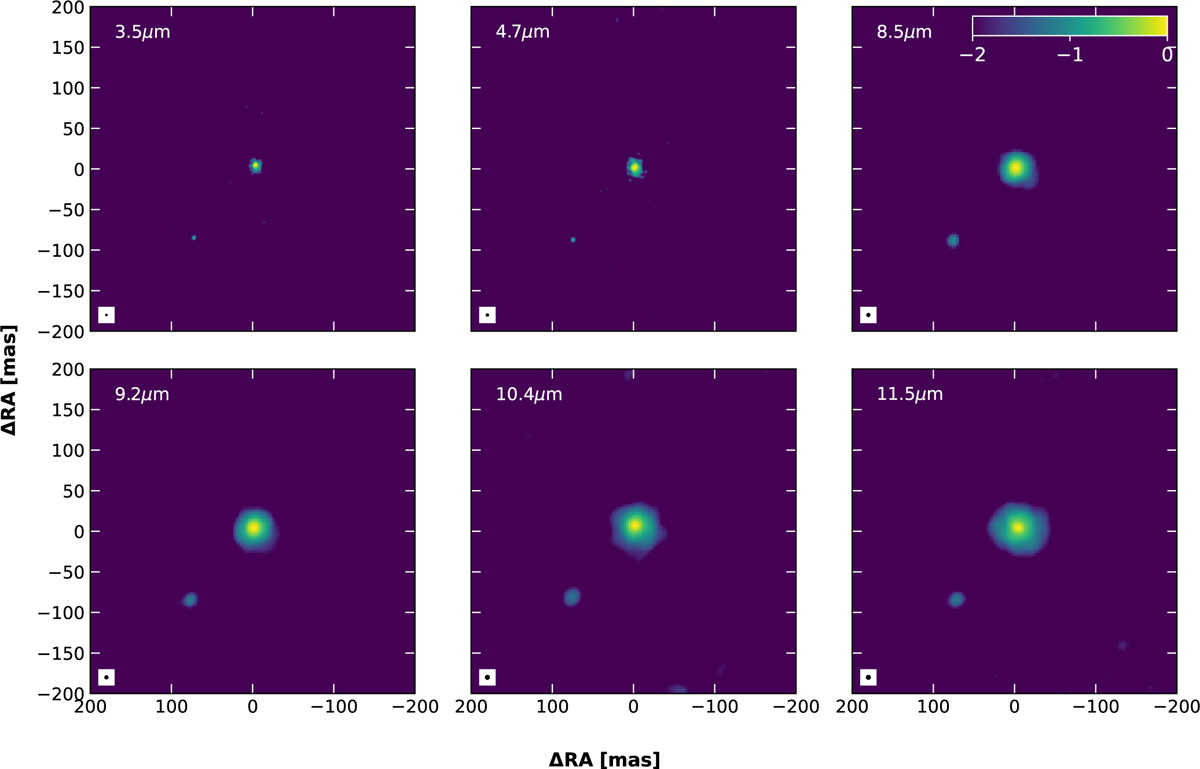
MiRA image reconstructions in L, M, and N bands during the 2023 outburst. From left to right and top to bottom, these correspond to pseudo-continuum reconstructed images at 3.5, 4.7, 8.5, 9.2, 10.4, and 11.5 μm. These are smoothed with a Gaussian beam with a FWHM similar to the image resolution, normalized to unity, and shown in a logarithmic stretch with a minimum value of 10−2 to suppress image reconstruction residuals below that level. Such residuals are the result of insufficient uv coverage (Fig. 3). The SE component (FUor) becomes much fainter than the NW component (HBe) at longer wavelengths. The beam size is shown as a black circle at the bottom left corner of each panel.
Current usage metrics show cumulative count of Article Views (full-text article views including HTML views, PDF and ePub downloads, according to the available data) and Abstracts Views on Vision4Press platform.
Data correspond to usage on the plateform after 2015. The current usage metrics is available 48-96 hours after online publication and is updated daily on week days.
Initial download of the metrics may take a while.