Open Access
Fig. 7
Download original image
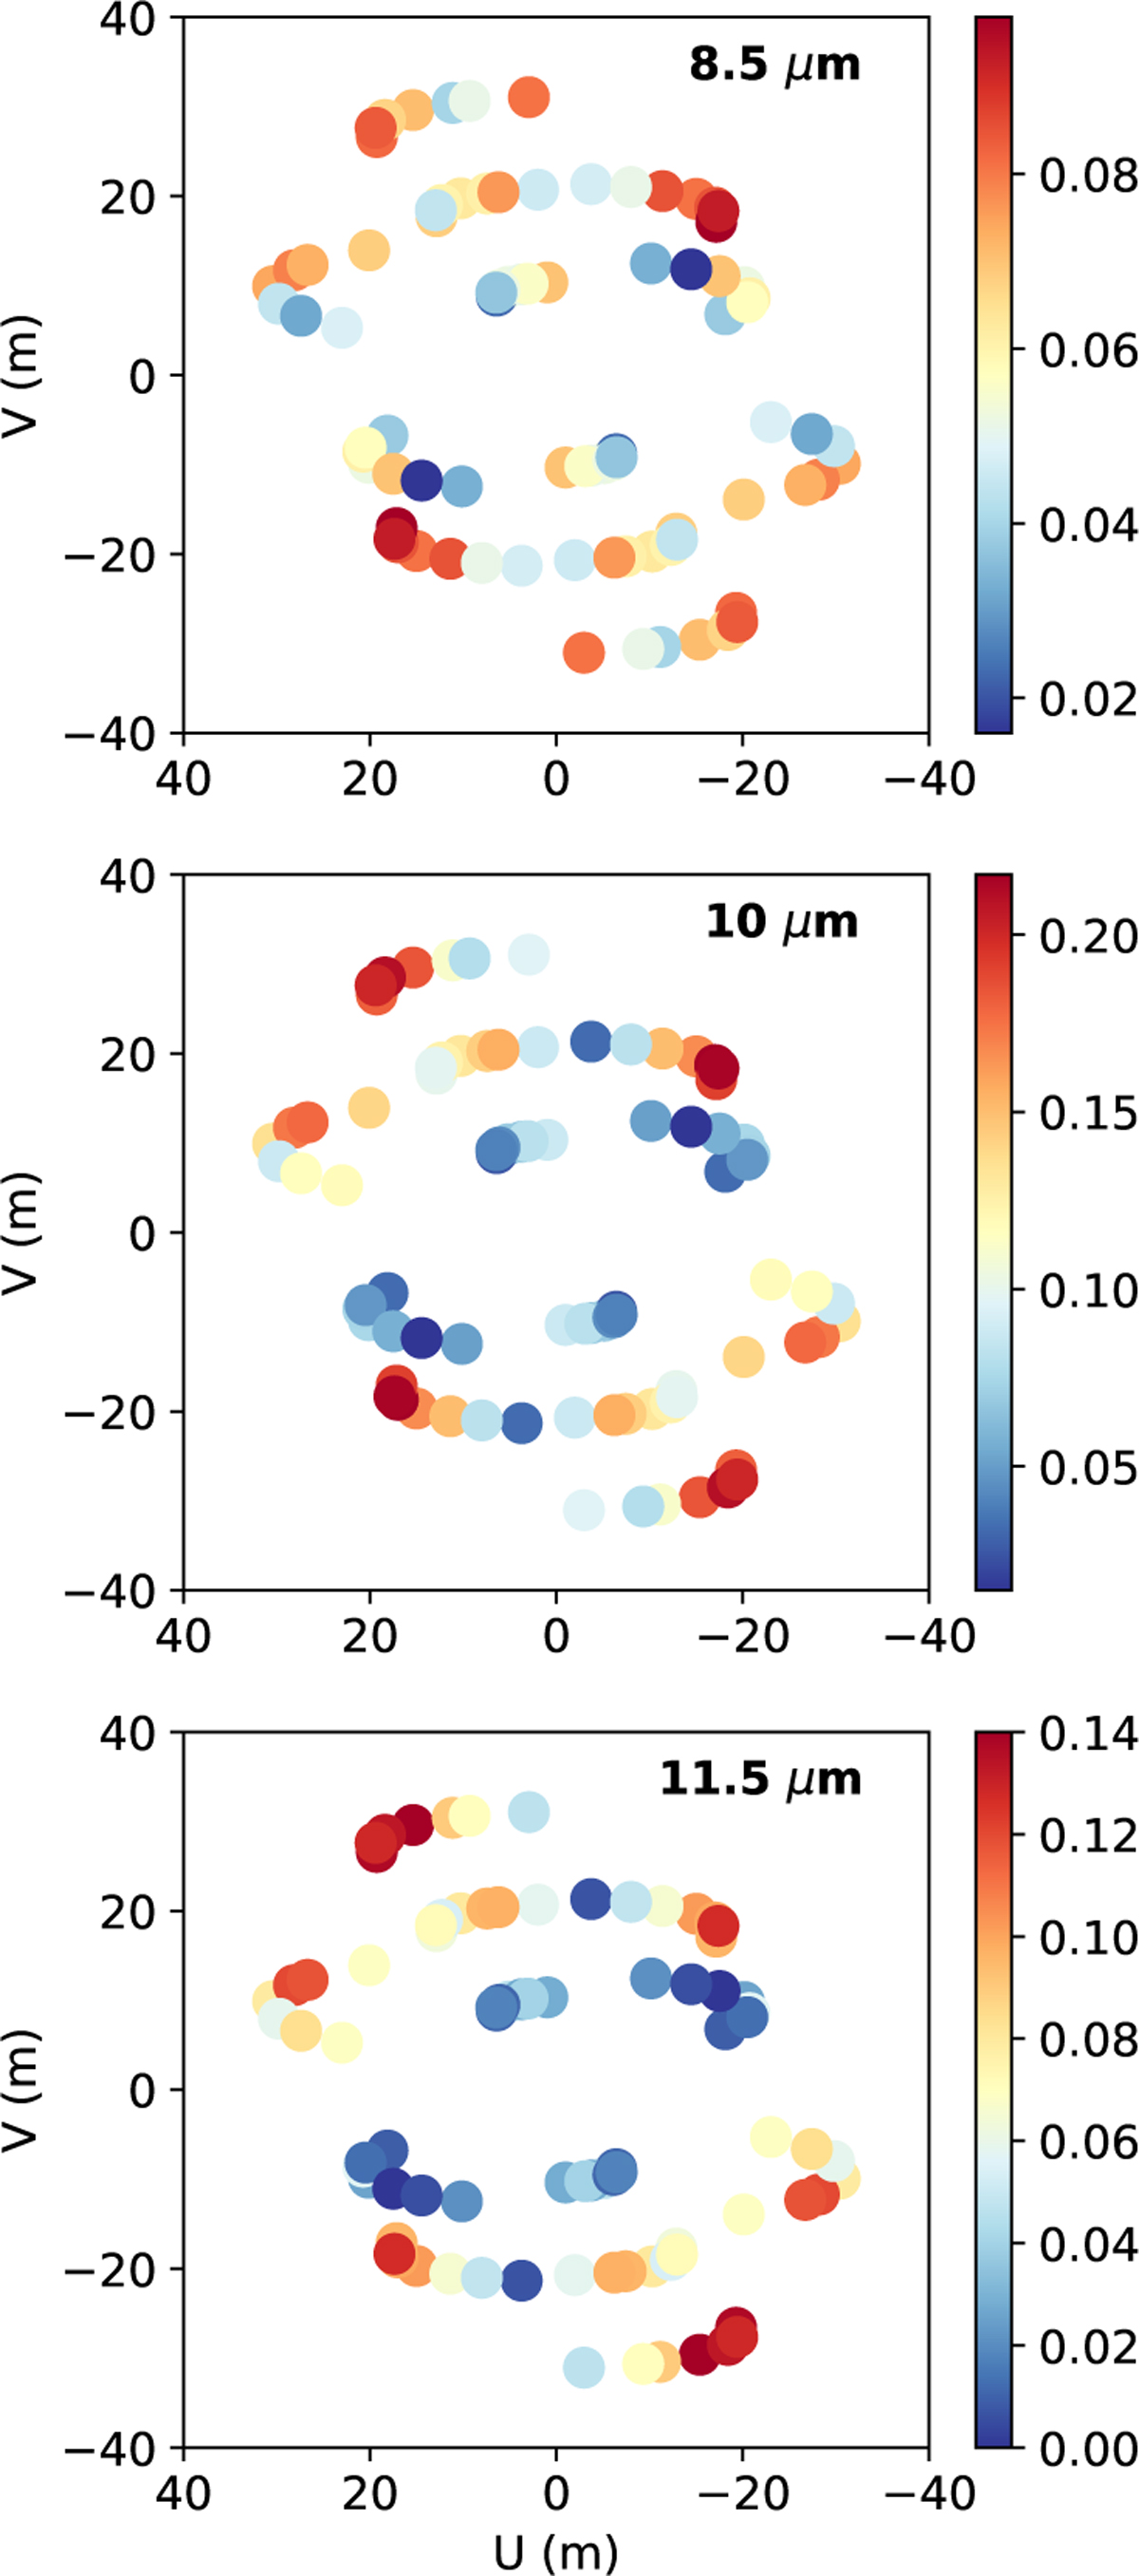
Optical-depth uv maps of Z CMa. These correspond, from top to bottom, to 8.5, 10, and 11.5 μm, and the uv coverage is that of the small array (see also Fig. 3). The optical depth varies per wavelength, as indicated by each individual color bar, as well as per spatial scale probed by MATISSE (see Sects. 3.3 and 4.2).
Current usage metrics show cumulative count of Article Views (full-text article views including HTML views, PDF and ePub downloads, according to the available data) and Abstracts Views on Vision4Press platform.
Data correspond to usage on the plateform after 2015. The current usage metrics is available 48-96 hours after online publication and is updated daily on week days.
Initial download of the metrics may take a while.