Fig. A.1
Download original image
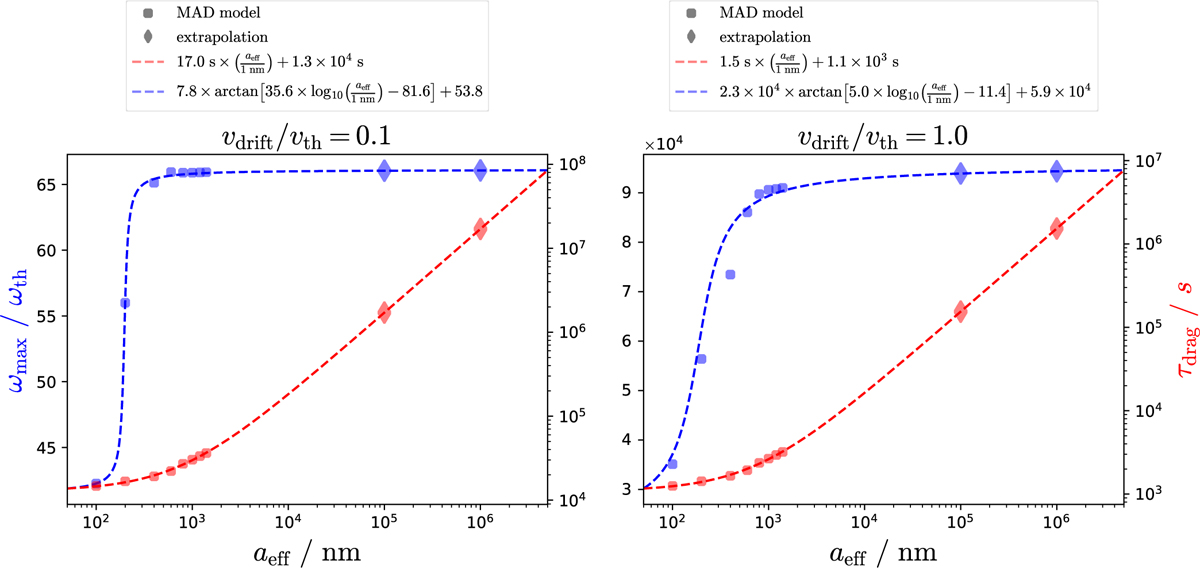
Average alignment over all BAM1 grain shapes according to the MAD model (dot shapes) and their extrapolation (diamond shapes) for the drag timescale tdrag (red) and the ratio of angular velocity ω (blue) with respect to the thermal angular velocity ωth dependent on the effective grain radius aeff. The data is modeled for the fiducial values of ng = 1010 cm−3, Tg = 20 K, and Td = 20 K. The left panel depicts data for the distinct ratio of the drift velocity vdrift to the thermal velocity vth with vdrift/vth = 0.1 while the right panel if for vdrift/vth = 1.0. The best fits (dashed lines) of τdrag are performed via τdrag = a ×(aeff/1 nm)+b and ω/ωth = a × arctan [b × log10(aeff/1 nm)+c]+d, respectively. The MAD data is extrapolated data for the two particular grain species of aeff = 100 μm as well as aeff = 1 mm utilized in this paper.
Current usage metrics show cumulative count of Article Views (full-text article views including HTML views, PDF and ePub downloads, according to the available data) and Abstracts Views on Vision4Press platform.
Data correspond to usage on the plateform after 2015. The current usage metrics is available 48-96 hours after online publication and is updated daily on week days.
Initial download of the metrics may take a while.