Fig. B.1
Download original image
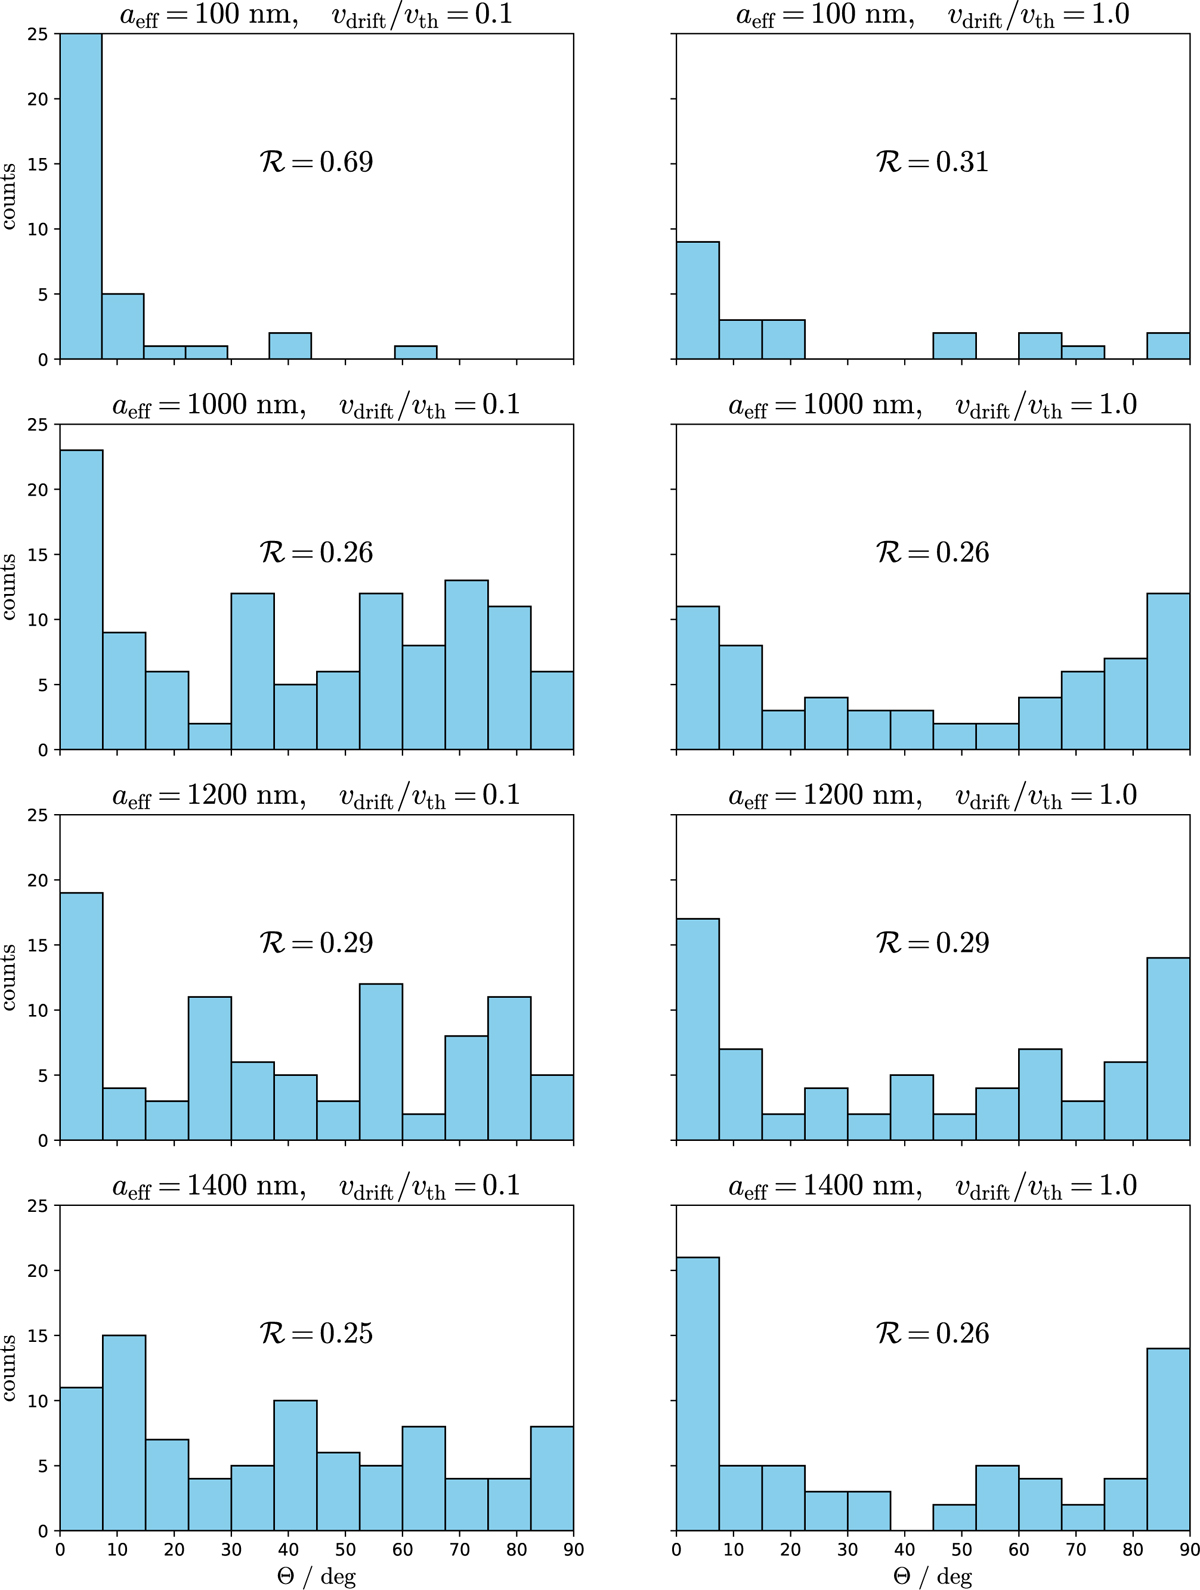
Distribution of the alignment angle Θ (compare Fig. 1) of a distinct ensemble of BAM1 dust aggregates according to the MAD framework. The four rows (top, second, third, bottom) show the distribution for an effective radius of aeff = 100 nm, aeff = 1000 nm, aeff = 1200 nm, and aeff = 1400 nm, respectively. Individual alignment angles Θ are simulated for fiducial values of ng = 1010 cm−3, Tg = 20 K, and Td = 20 K whereas the left column is for the ratio of velocities vdrift/vth = 0.1 while the right column is for the ratio vdrift/vth = 1.0. The Rayleigh reduction factor ℛ (see Eq. 4) is calculated considering both the distribution of Θ within 0∘ to 90∘ and the ratio ζ of grains that either do not align with the velocity field at all because of slow rotation or grains that are rotationally destroyed.
Current usage metrics show cumulative count of Article Views (full-text article views including HTML views, PDF and ePub downloads, according to the available data) and Abstracts Views on Vision4Press platform.
Data correspond to usage on the plateform after 2015. The current usage metrics is available 48-96 hours after online publication and is updated daily on week days.
Initial download of the metrics may take a while.