Fig. 2
Download original image
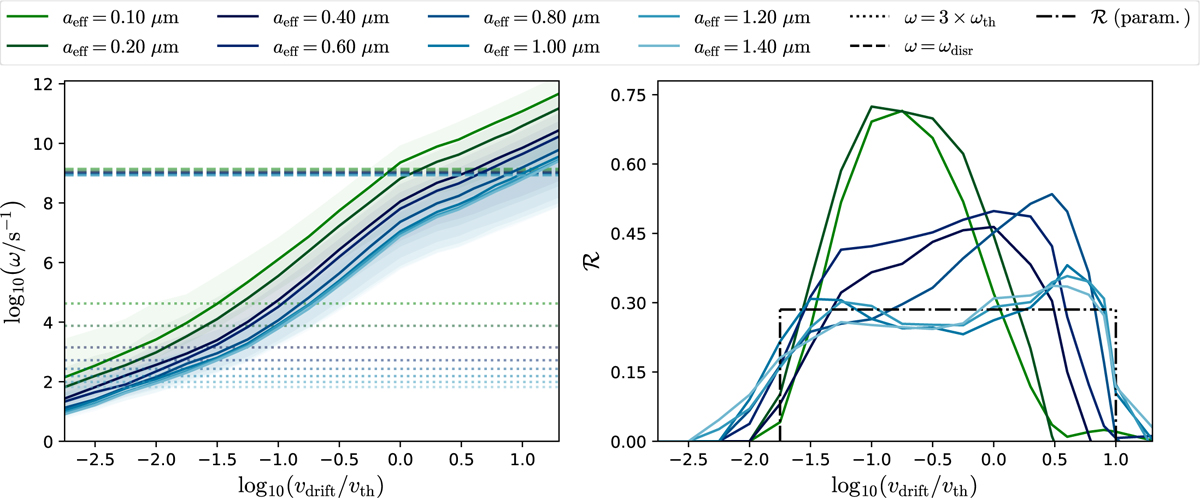
Left panel: Angular velocity, ω, as a function of the ratio vdrift/vth. The effective grain radii, aeff = 0.1 μm to 1.4 μ m, are color-coded. Solid lines represent the average values of ω, while the shaded areas indicate the range between the minimum and maximum values. Dotted lines show the lower limit, 3 × ωth, for long-term stable alignment, and dashed lines represent the upper limit for rotational disruption, ωdisr. Right panel: Same as the left panel, but for the Rayleigh reduction factor ℛ (solid lines). Dashed-dotted lines depict the parametric representation of ℛ for grains with aeff ≥ 1 μm. See Sect. 2.2 for details.
Current usage metrics show cumulative count of Article Views (full-text article views including HTML views, PDF and ePub downloads, according to the available data) and Abstracts Views on Vision4Press platform.
Data correspond to usage on the plateform after 2015. The current usage metrics is available 48-96 hours after online publication and is updated daily on week days.
Initial download of the metrics may take a while.