Fig. 19
Download original image
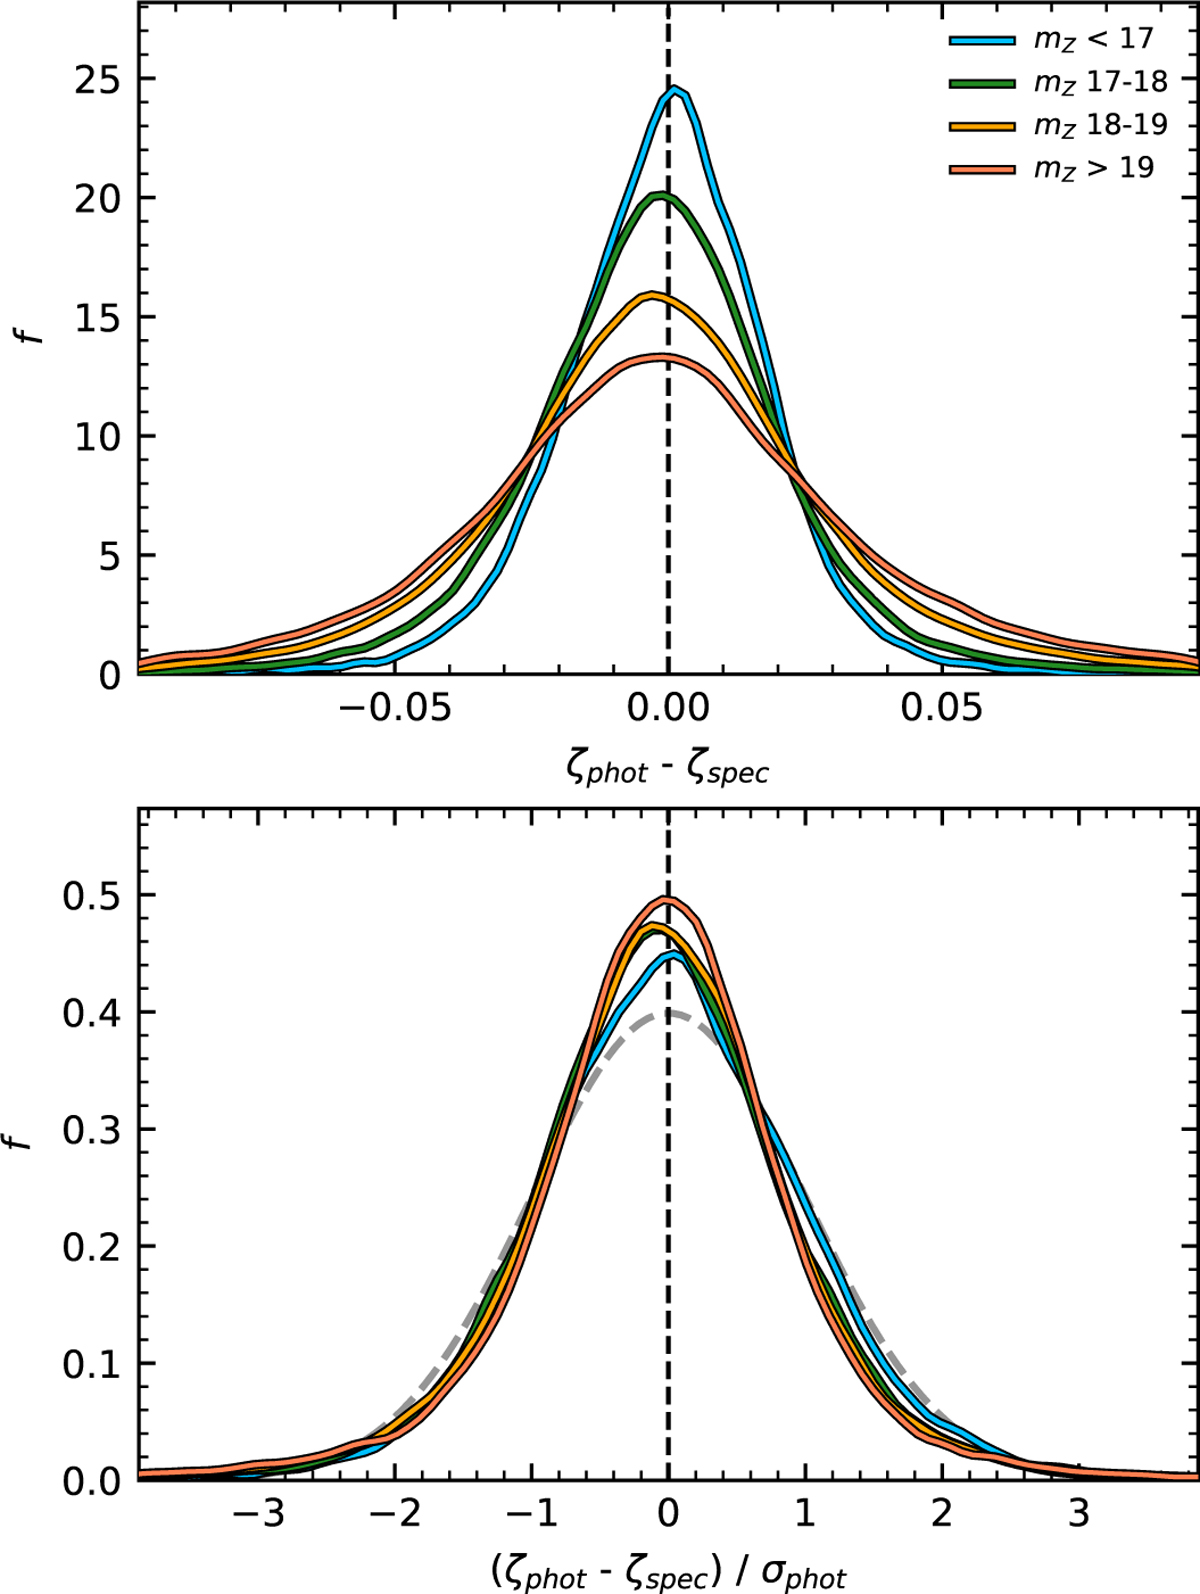
Photo-z accuracy in multiple magnitude ranges. Upper panel: the colours show the distribution of photo-z accuracy, which is given as the difference between the spectroscopic and photo-z estimates. The dashed black line is drawn at zero to identify any biases in the distributions. Lower panel: the distribution of redshift accuracies that are normalised by the width of their photo-z peak computed using Eq. (16). The dashed grey line shows a Gaussian distribution with a standard deviation of one.
Current usage metrics show cumulative count of Article Views (full-text article views including HTML views, PDF and ePub downloads, according to the available data) and Abstracts Views on Vision4Press platform.
Data correspond to usage on the plateform after 2015. The current usage metrics is available 48-96 hours after online publication and is updated daily on week days.
Initial download of the metrics may take a while.