Fig. 2
Download original image
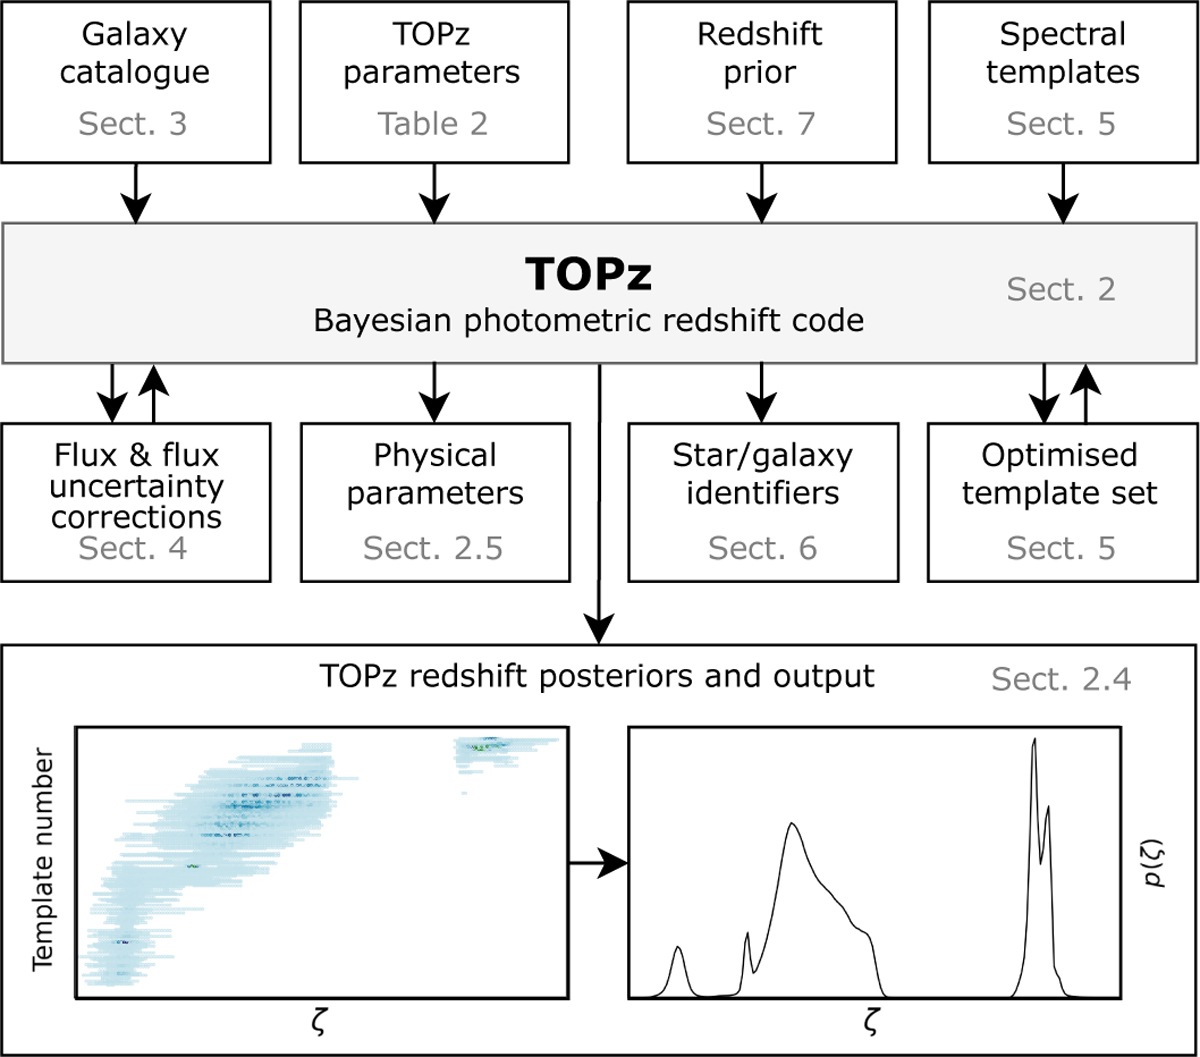
Schematic overview of the TOPz code, illustrating key inputs and outputs. The two-way arrows indicate that an iterative approach can be applied for further optimisation. Refer to the sections indicated in the corresponding boxes for additional information. See Fig. 3 for the detailed description of the TOPz posteriors and output.
Current usage metrics show cumulative count of Article Views (full-text article views including HTML views, PDF and ePub downloads, according to the available data) and Abstracts Views on Vision4Press platform.
Data correspond to usage on the plateform after 2015. The current usage metrics is available 48-96 hours after online publication and is updated daily on week days.
Initial download of the metrics may take a while.