Fig. 20
Download original image
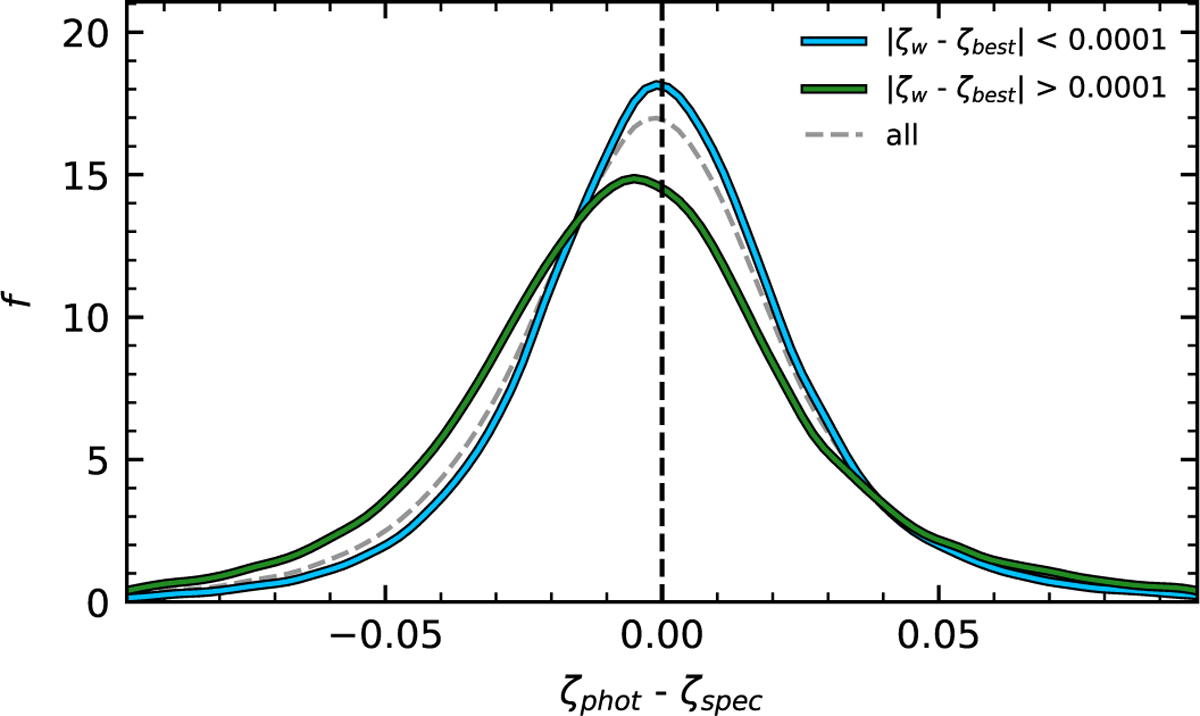
Photo-z accuracy distribution for two TOPz subsets. The blue line shows the subset where ζbest and ζw are closer than 0.0001, and the green line shows the subset with the rest of the galaxies. The dashed grey line is the distribution for the whole sample. The value 0.0001 was chosen so the subsets would contain roughly comparable numbers of galaxies.
Current usage metrics show cumulative count of Article Views (full-text article views including HTML views, PDF and ePub downloads, according to the available data) and Abstracts Views on Vision4Press platform.
Data correspond to usage on the plateform after 2015. The current usage metrics is available 48-96 hours after online publication and is updated daily on week days.
Initial download of the metrics may take a while.