Fig. 21
Download original image
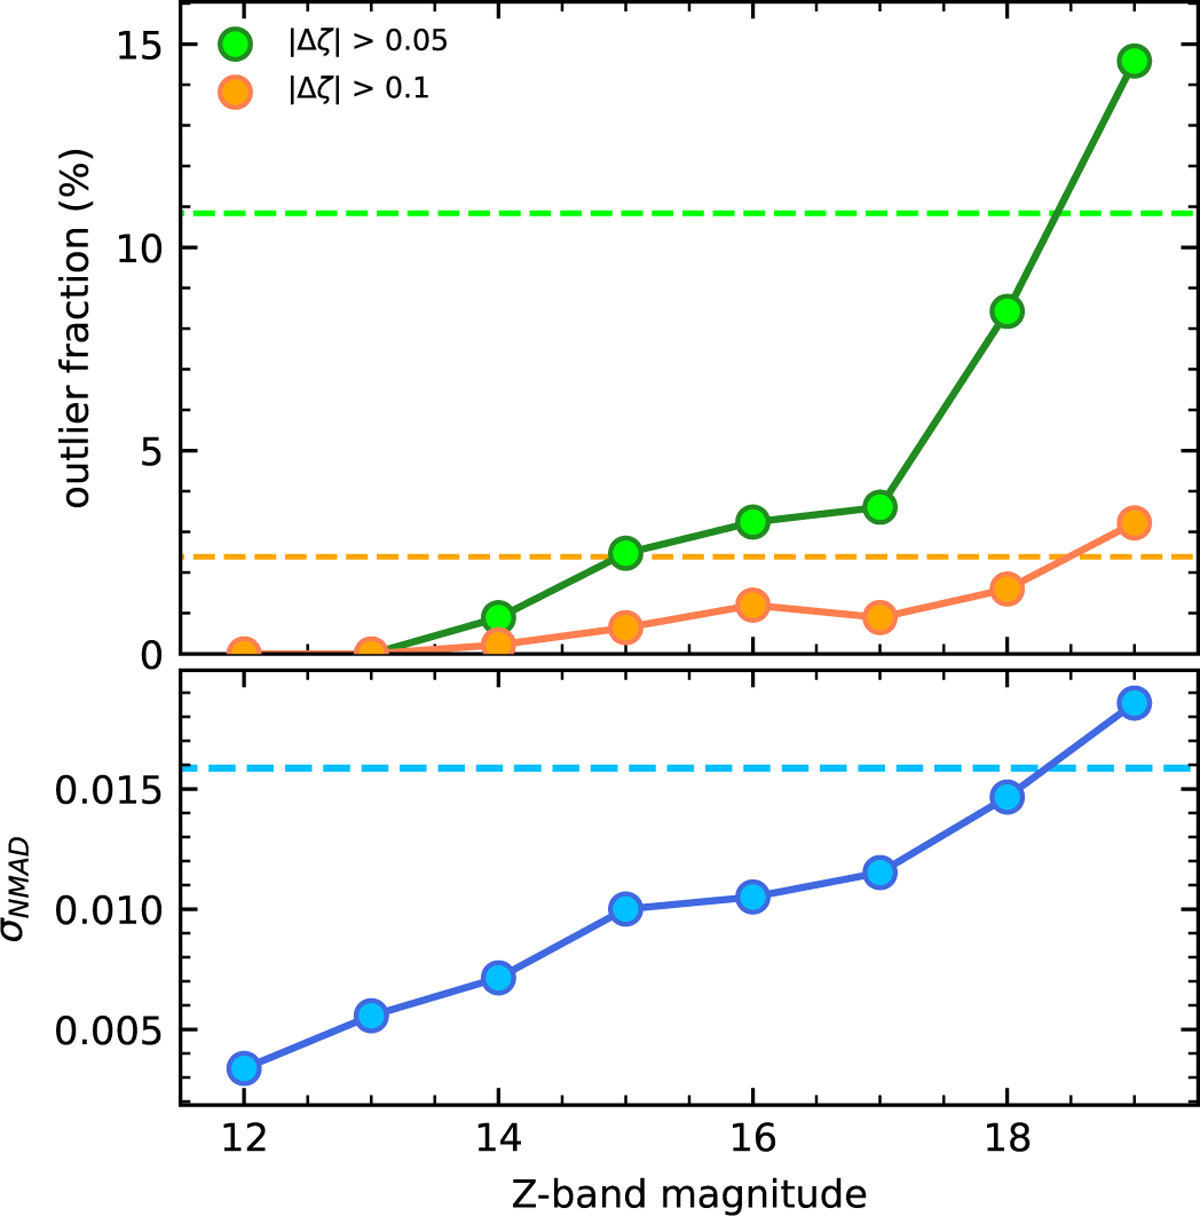
TOPz photo-z statistics as a function of the apparent Z-band magnitude. Photo-z accuracy is defined as σNMAD (see Sect. 8.2 and Eq. (39)). Outlier fraction is defined using redshift ζ absolute deviation from spectroscopic redshift for two different Δζ thresholds: 0.05 and 0.1. Upper panel: outlier fraction as a function of apparent magnitude. The outlier fractions for two different thresholds are marked in green and orange colours. The coloured dashed lines show the outlier fractions over the whole galaxy sample. Lower panel: photo-z accuracy distribution widths as described by the σNMAD value. The dashed line shows the σNMAD value calculated over the whole galaxy set.
Current usage metrics show cumulative count of Article Views (full-text article views including HTML views, PDF and ePub downloads, according to the available data) and Abstracts Views on Vision4Press platform.
Data correspond to usage on the plateform after 2015. The current usage metrics is available 48-96 hours after online publication and is updated daily on week days.
Initial download of the metrics may take a while.