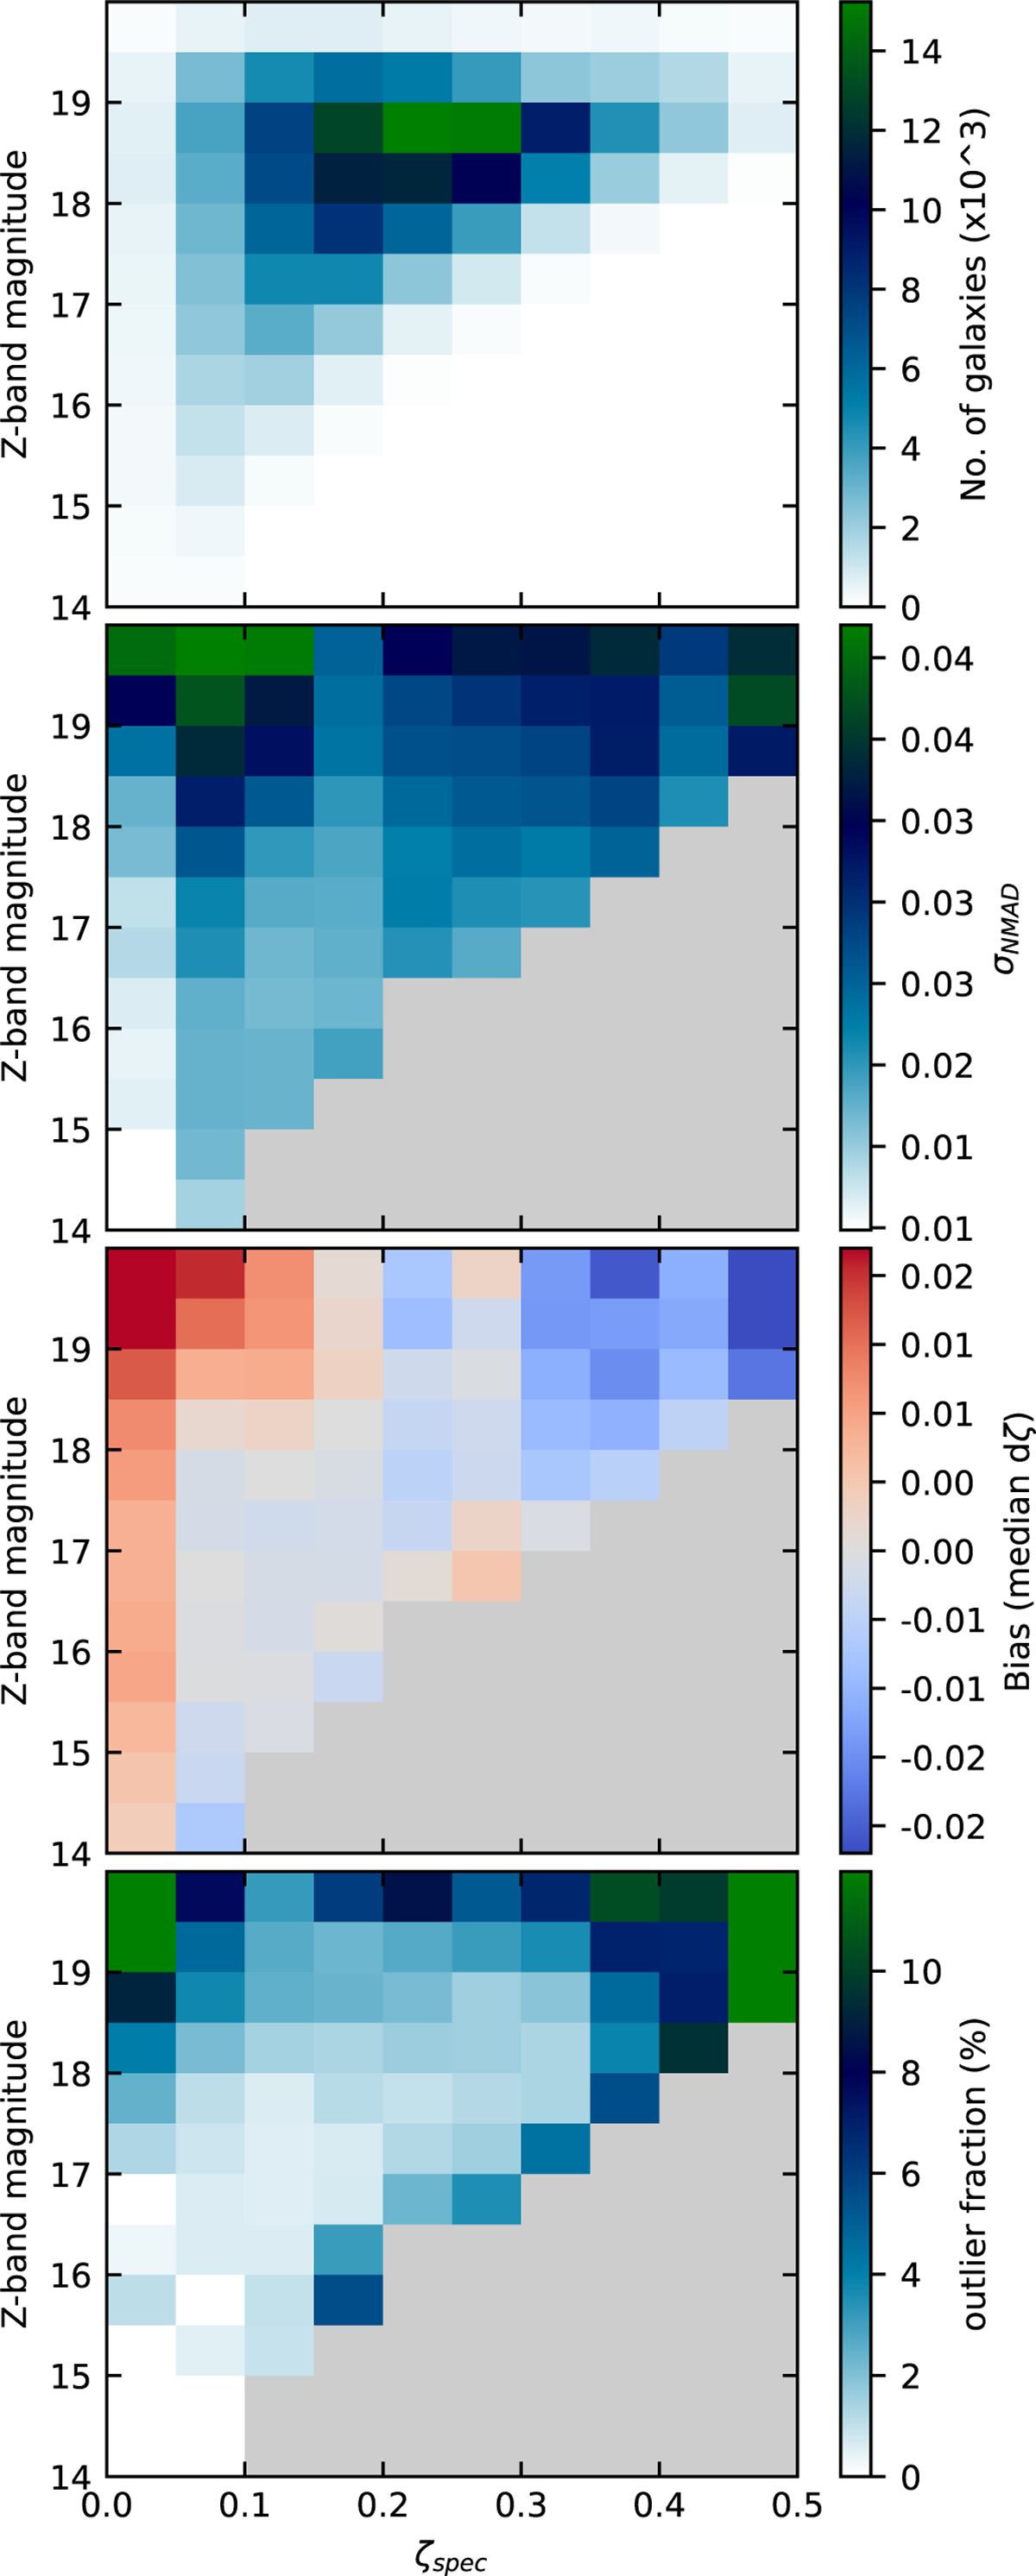
Fig. 22
Download original image
Photo-z estimation parameter map on a magnitude - ζspec grid. The top panel shows the number of galaxies in each bin. The three parameters from the second to the bottom panel are photo-z accuracy distribution width (σNMAD value), the bias of that distribution as the median value of the photometric accuracy, and the outlier rate as the number of galaxies with photometric accuracy worse than 0.1. Bins with fewer than 100 galaxies are drawn as grey areas.
Current usage metrics show cumulative count of Article Views (full-text article views including HTML views, PDF and ePub downloads, according to the available data) and Abstracts Views on Vision4Press platform.
Data correspond to usage on the plateform after 2015. The current usage metrics is available 48-96 hours after online publication and is updated daily on week days.
Initial download of the metrics may take a while.