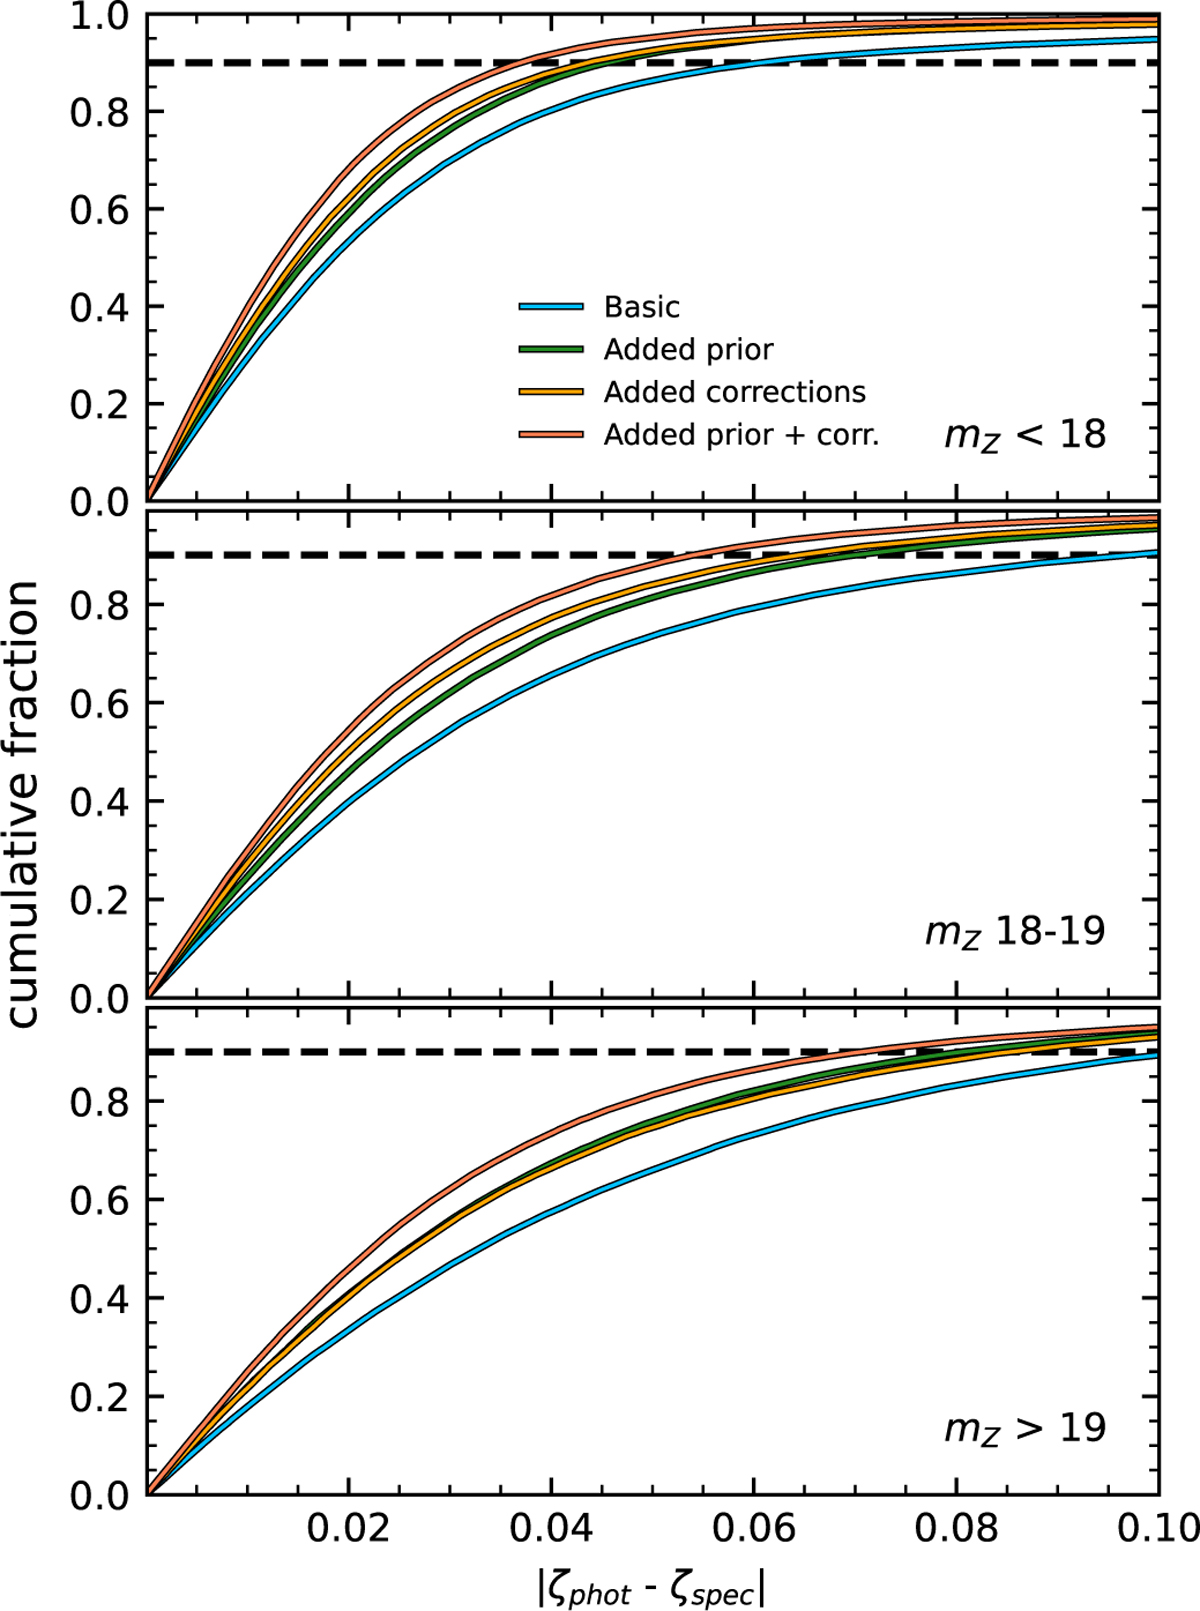
Fig. 23
Download original image
TOPz feature comparison in three magnitude ranges (different panels). The coloured lines show the cumulative fraction of objects with a certain photo-z accuracy. Each coloured line represents a different TOPz run with certain features turned on or off, as described by the legend on the top panel. The three panels have different sets of galaxies based on their Z-band magnitude (as shown in the bottom-right corner of each panel). The dashed black line indicates the 90% fraction to help better distinguish the accuracies on each panel. See Fig. 19 for the differential distribution of differences between spectroscopic redshifts and photo-z.
Current usage metrics show cumulative count of Article Views (full-text article views including HTML views, PDF and ePub downloads, according to the available data) and Abstracts Views on Vision4Press platform.
Data correspond to usage on the plateform after 2015. The current usage metrics is available 48-96 hours after online publication and is updated daily on week days.
Initial download of the metrics may take a while.