Fig. 25
Download original image
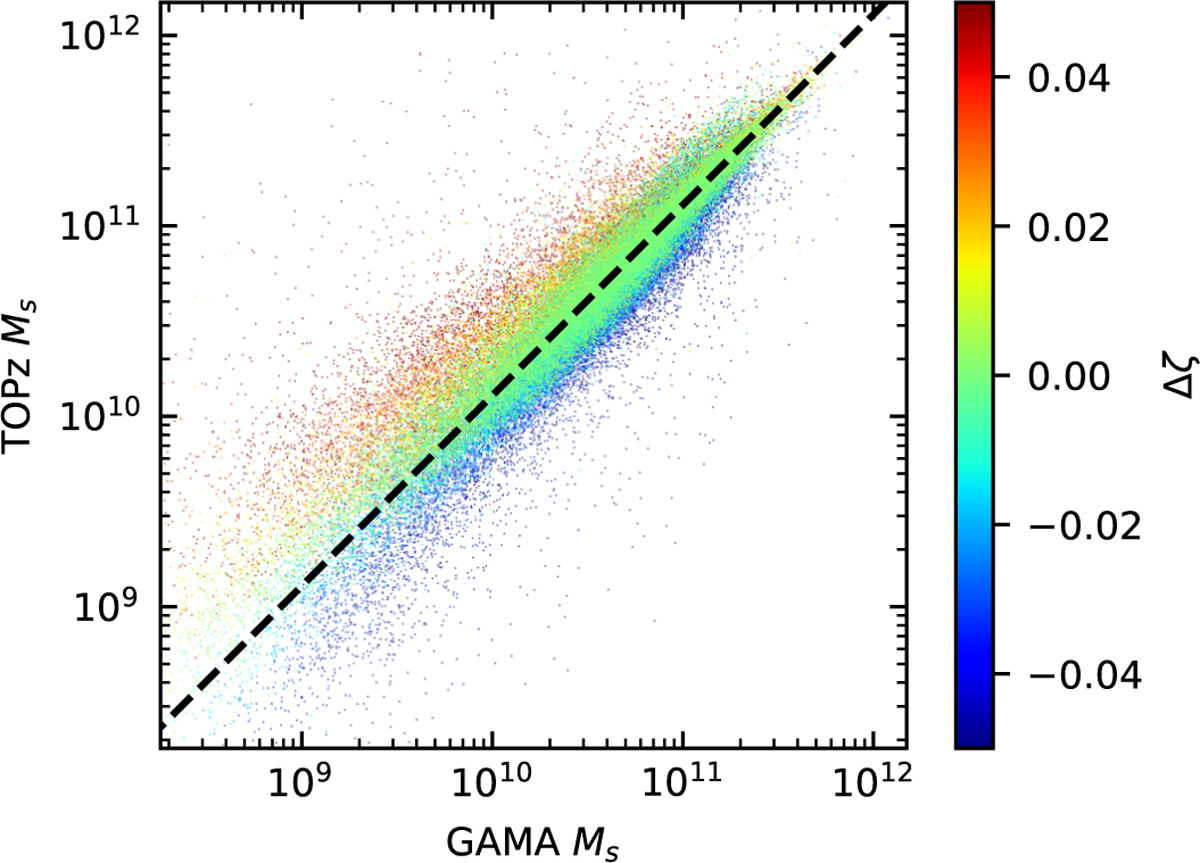
Comparison between TOPz and GAMA stellar masses for each galaxy. The x-axis shows the GAMA stellar masses acquired using GKV ProFound photometry (see Sect. 3). The y-axis shows the TOPz stellar masses that are computed using the spectral templates from the CIGALE software (see Sect. 2.5). The colour denotes the TOPz photo-z accuracy. The dashed black line is a median stellar mass ratio relation, where M★,TOPz ≈ 1.3 ⋅ M★,GAMA. Galaxies where TOPz photo-z are close to the spectroscopic redshiſts follow the stellar masses from the GAMA database very well.
Current usage metrics show cumulative count of Article Views (full-text article views including HTML views, PDF and ePub downloads, according to the available data) and Abstracts Views on Vision4Press platform.
Data correspond to usage on the plateform after 2015. The current usage metrics is available 48-96 hours after online publication and is updated daily on week days.
Initial download of the metrics may take a while.