Fig. 3
Download original image
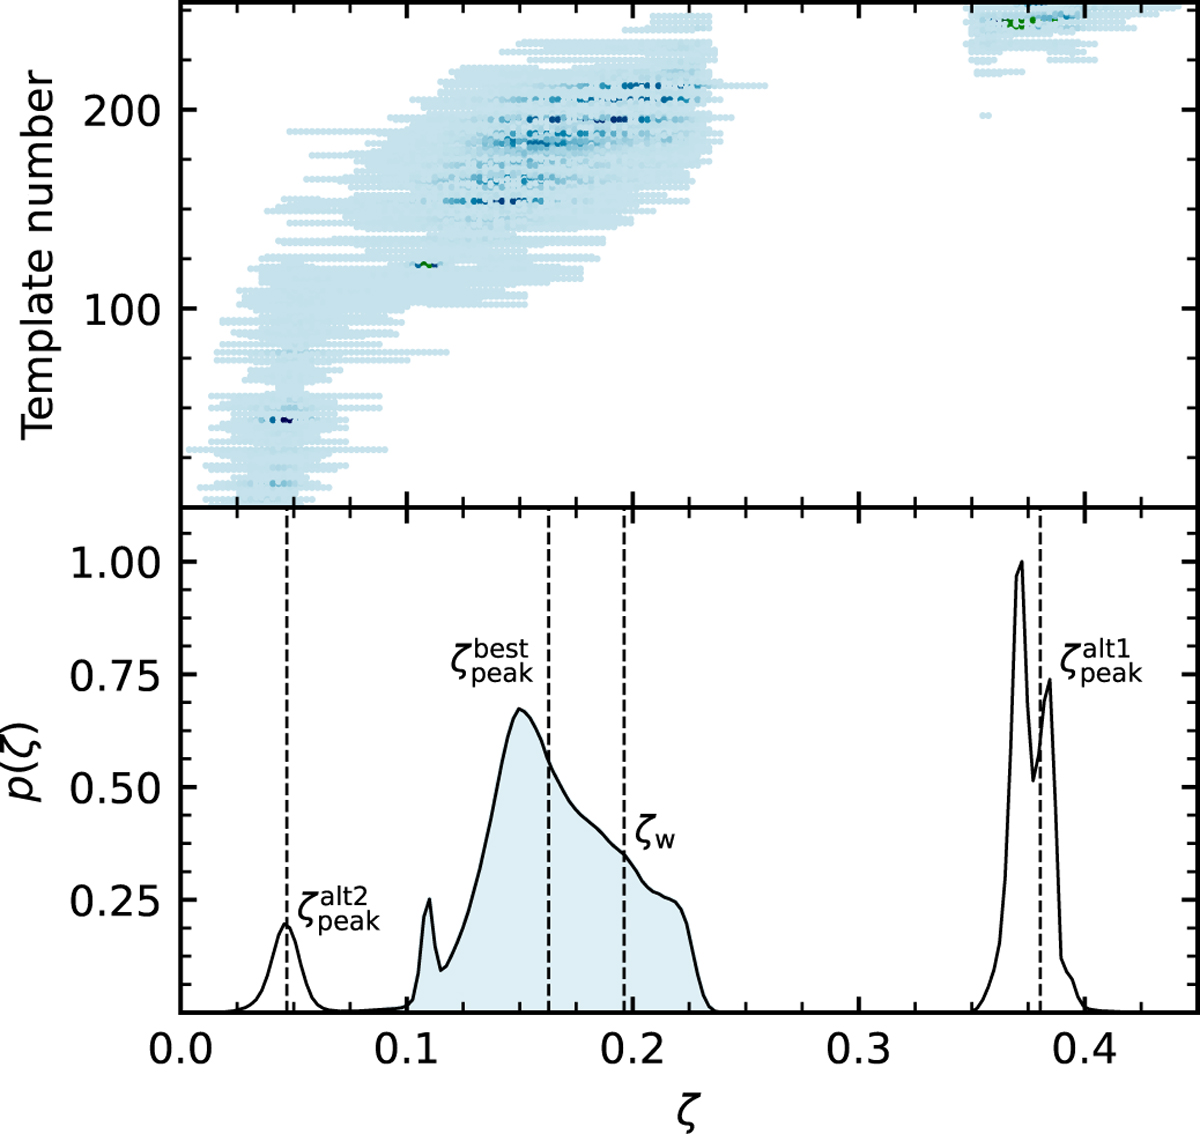
TOPz redshift posterior for a source with many maxima and a spectroscopic redshift of z ≈ 0.21 (ζ ≈ 0.19). The upper panel displays a 2D posterior distribution, with all templates arranged in order of increasing weighted ζ values. The colour of each point represents the photo-z likelihood of the corresponding template. The lower panel illustrates the marginalised posterior distribution for the same source. Dashed vertical lines indicate the ζ values for all peaks along with ζw. For details on the definitions of the three peaks and the probability-weighted ζw, refer to Sect. 2.4. The shaded area in the lower panel represents the range of the best peak, bounded by the minimum (![]() ) and maximum (
) and maximum (![]() ) values.
) values.
Current usage metrics show cumulative count of Article Views (full-text article views including HTML views, PDF and ePub downloads, according to the available data) and Abstracts Views on Vision4Press platform.
Data correspond to usage on the plateform after 2015. The current usage metrics is available 48-96 hours after online publication and is updated daily on week days.
Initial download of the metrics may take a while.