Fig. 6
Download original image
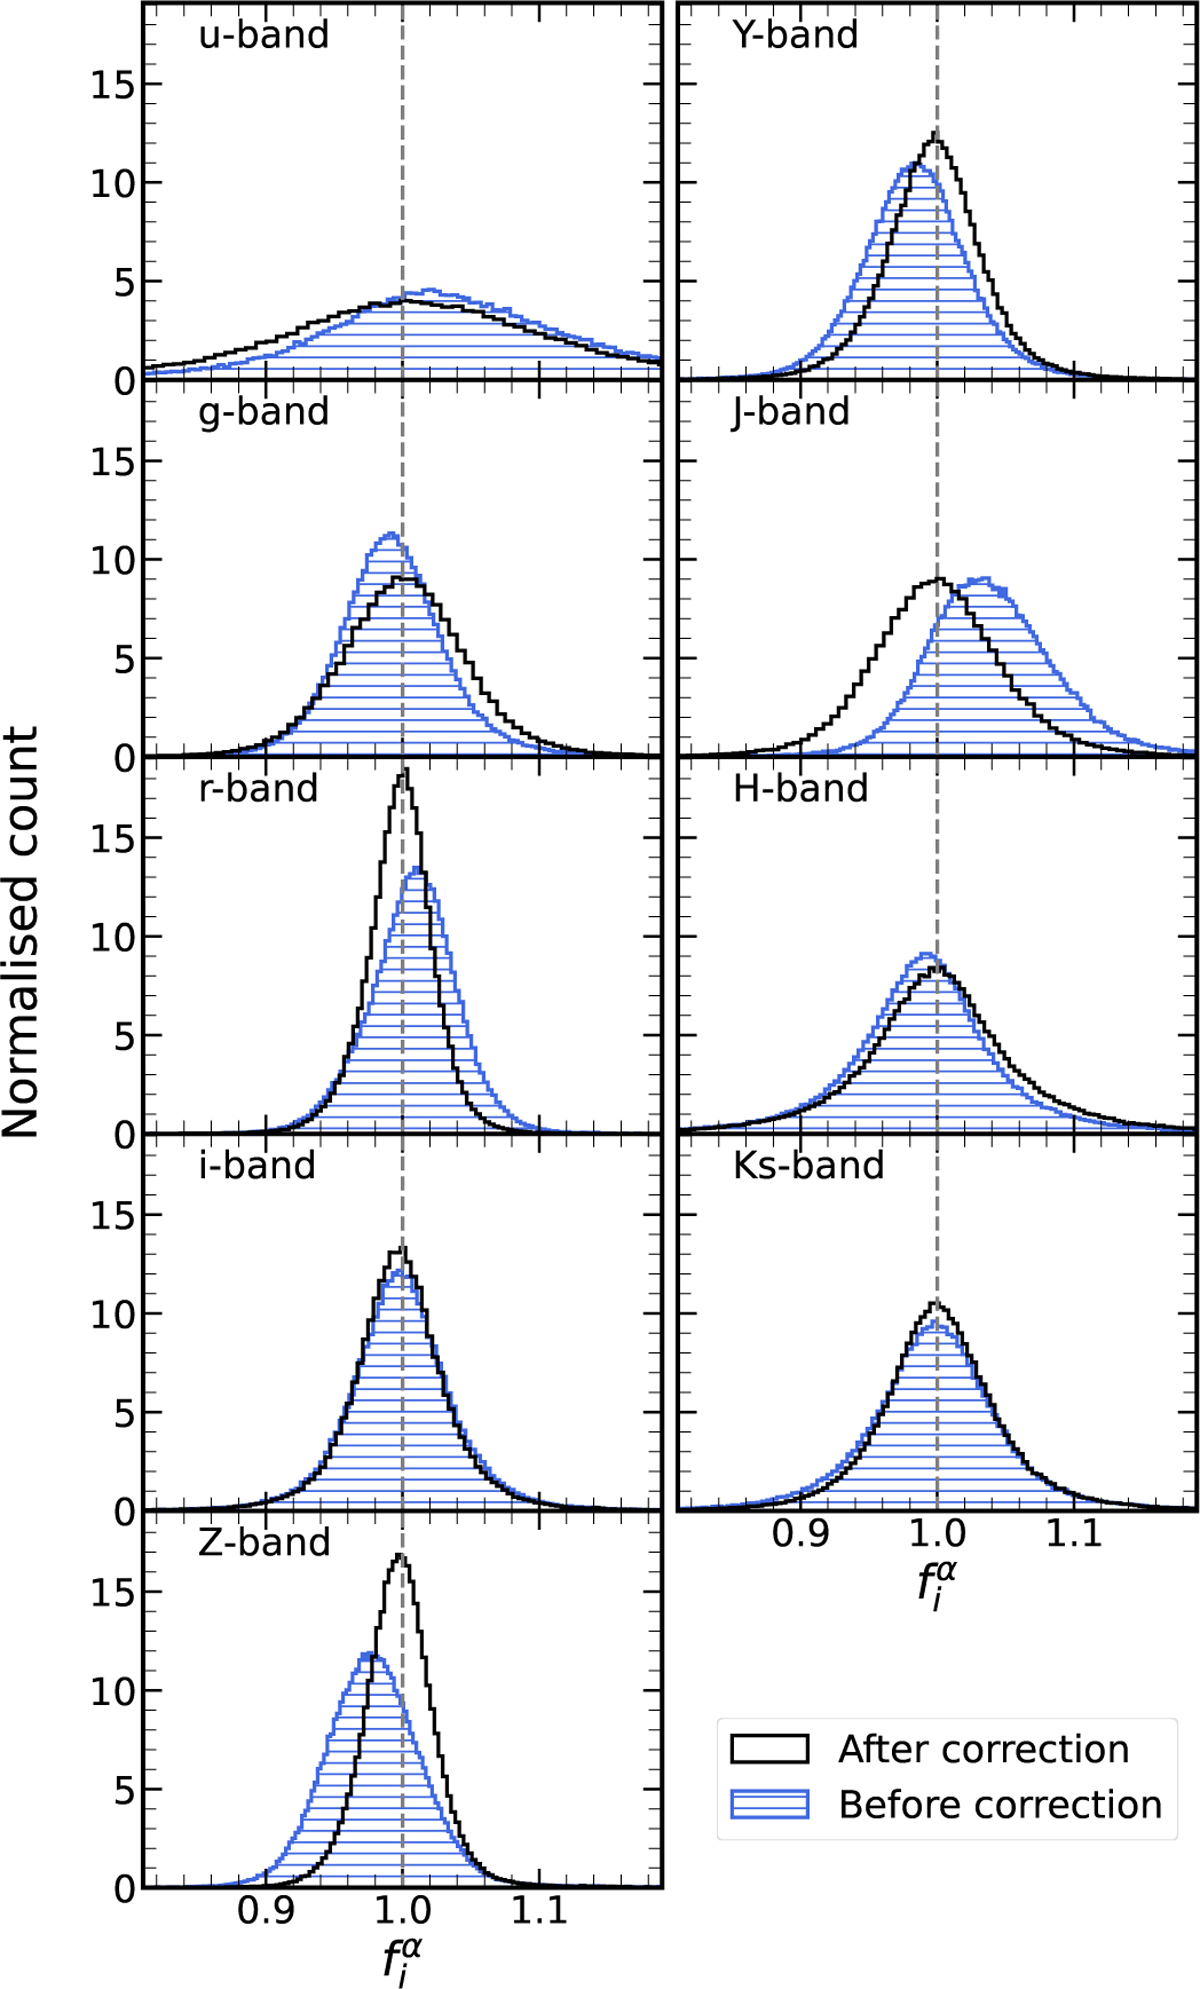
Flux bias corrections for the GAMA spectroscopic sample. The distribution of flux ratios ![]() (model flux divided by observed flux) for the best-fitting spectral template at spectroscopic redshift. Each panel shows the
(model flux divided by observed flux) for the best-fitting spectral template at spectroscopic redshift. Each panel shows the ![]() distribution for different passbands. The area under the histograms is normalised to unity. The blue-shaded region shows the flux bias before any corrections. The black line shows the flux bias
distribution for different passbands. The area under the histograms is normalised to unity. The blue-shaded region shows the flux bias before any corrections. The black line shows the flux bias ![]() distribution after corrections. The flux bias correction is defined with Eqs. (18)–(20). See Sect. 4 for a detailed description of the flux and flux uncertainty corrections. As expected, the flux bias correction shifts the distribution median closer to unity (dashed vertical line). Table 1 shows the flux bias correction values for each passband.
distribution after corrections. The flux bias correction is defined with Eqs. (18)–(20). See Sect. 4 for a detailed description of the flux and flux uncertainty corrections. As expected, the flux bias correction shifts the distribution median closer to unity (dashed vertical line). Table 1 shows the flux bias correction values for each passband.
Current usage metrics show cumulative count of Article Views (full-text article views including HTML views, PDF and ePub downloads, according to the available data) and Abstracts Views on Vision4Press platform.
Data correspond to usage on the plateform after 2015. The current usage metrics is available 48-96 hours after online publication and is updated daily on week days.
Initial download of the metrics may take a while.