Fig. 7
Download original image
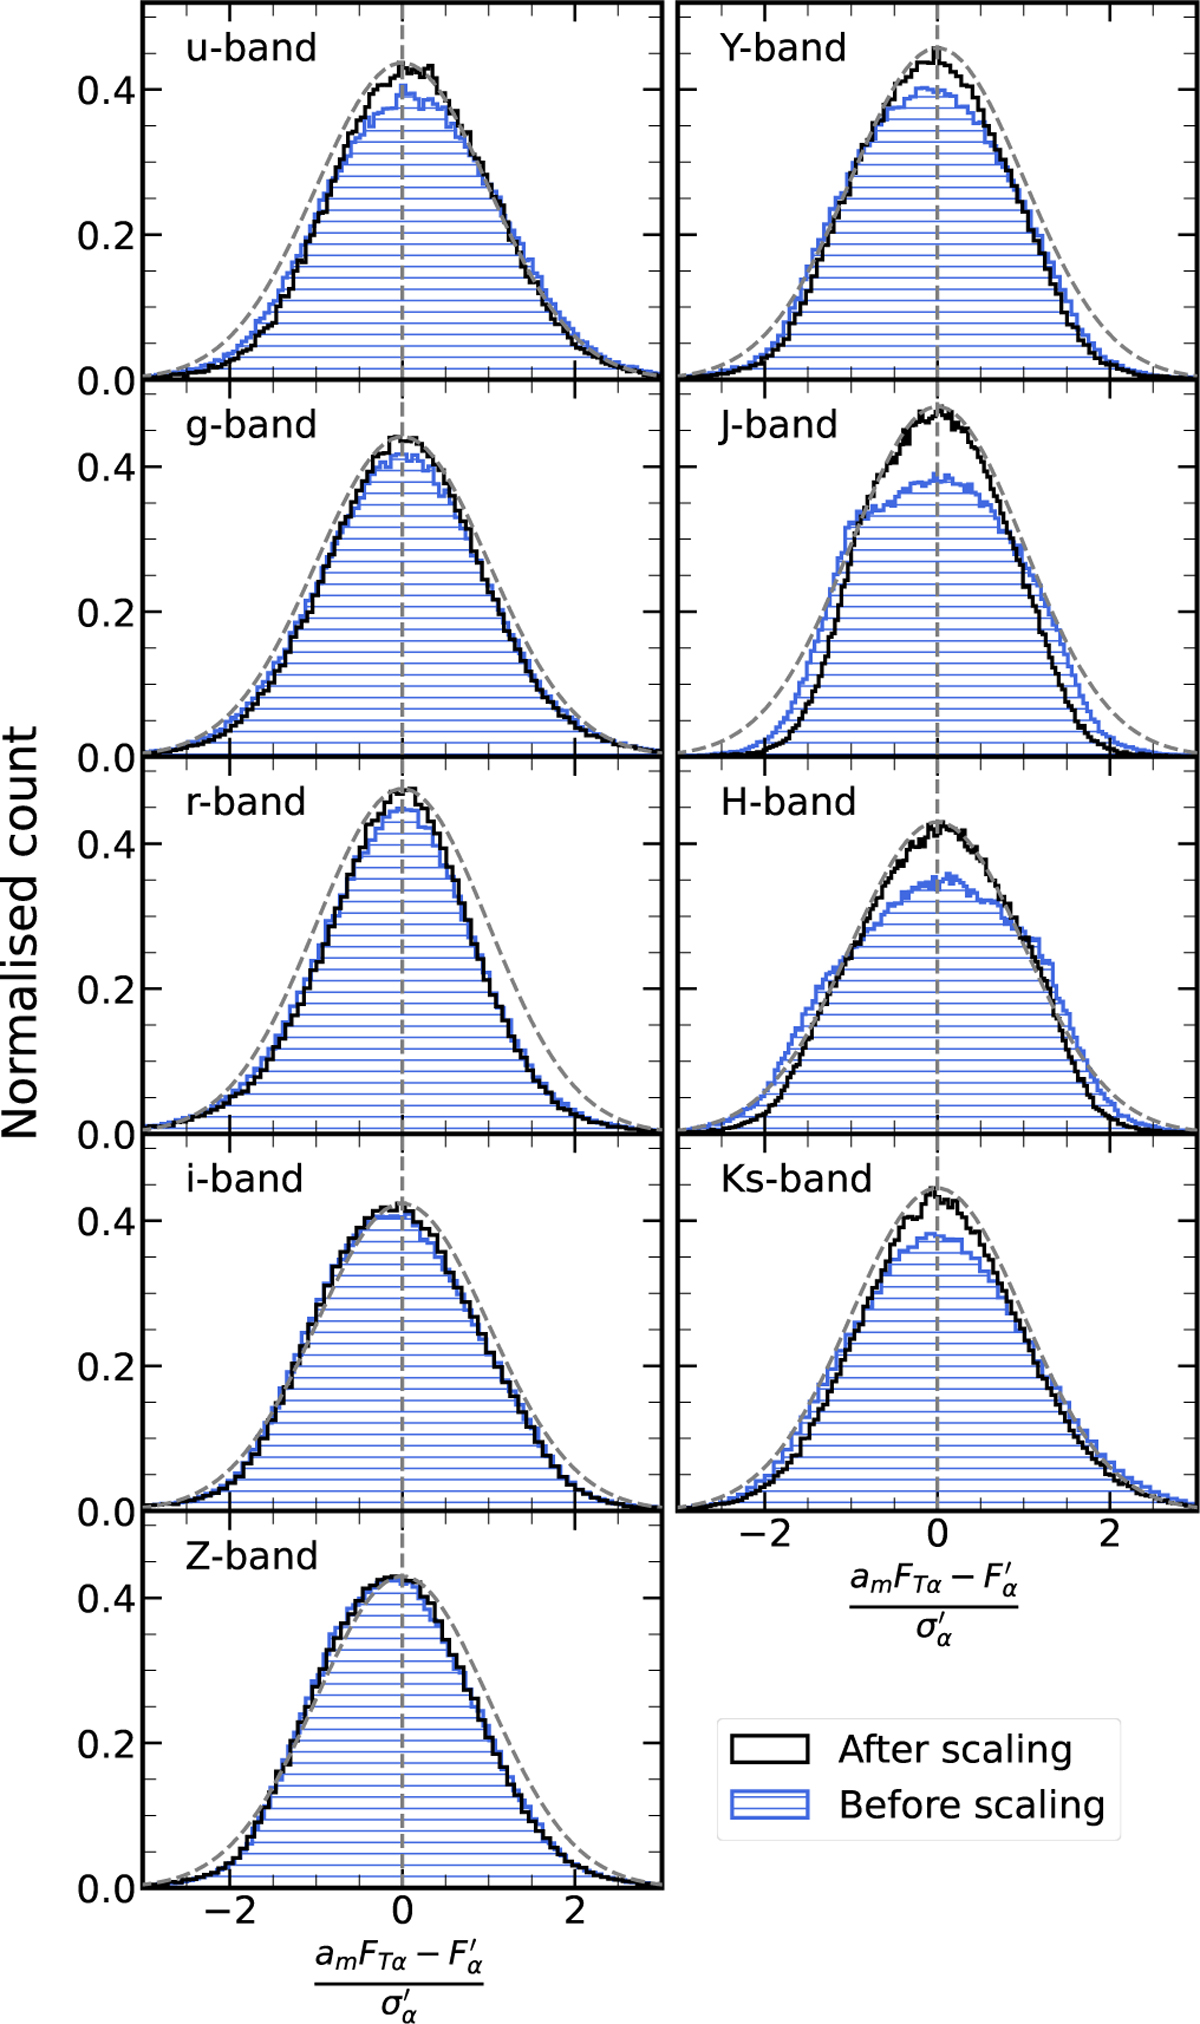
Difference between the model and observed flux divided by the observed flux uncertainty for the best-fitting spectral template at spectroscopic redshift. Each panel shows the distribution for different passbands. The blue-shaded histogram shows the distribution before flux uncertainty scaling. The solid black histogram shows the distribution after flux uncertainty scaling. The dashed grey line shows the Gaussian distribution with unit variance. See Sect. 4 for a detailed description of the flux and flux uncertainty corrections. As expected, the flux uncertainty scaling is shifting the normalised distribution closer to the theoretical Gaussian distribution. Table 1 gives the flux uncertainty scaling parameters for different passbands.
Current usage metrics show cumulative count of Article Views (full-text article views including HTML views, PDF and ePub downloads, according to the available data) and Abstracts Views on Vision4Press platform.
Data correspond to usage on the plateform after 2015. The current usage metrics is available 48-96 hours after online publication and is updated daily on week days.
Initial download of the metrics may take a while.