Fig. 2.
Download original image
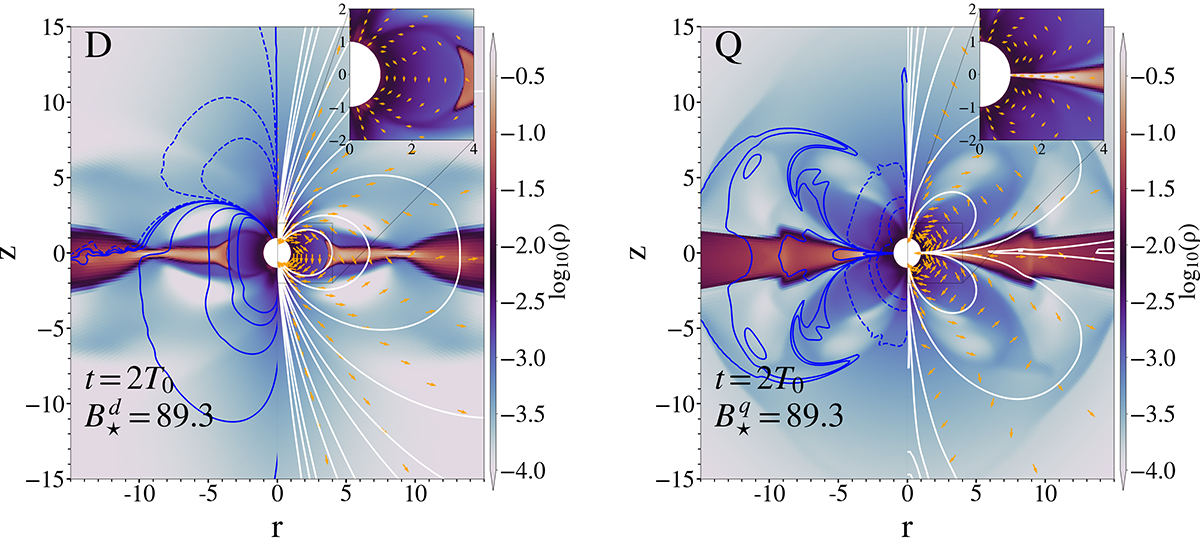
Density maps (in units of ρ0) at t = 2T0 for a dipolar (D model) magnetic configuration (left panel) and for a quadrupolar (Q model) magnetic configuration (right panel). The blue lines on the left side of each panel show the angular momentum flux (fB) carried by the field (see Eq. (16)), with solid blue indicating positive flux and dashed blue indicating negative flux. In the right side of each panel, the yellow vectors show the velocity and the white lines represent the poloidal magnetic field lines. Lastly, inserts show a zoomed-in view of a region of the density map where R < Rco where the gas clearly follows different paths toward the star for the D and Q models. However, it is worth noting that, in both cases, the gas flow toward the star is symmetric about the midplane.
Current usage metrics show cumulative count of Article Views (full-text article views including HTML views, PDF and ePub downloads, according to the available data) and Abstracts Views on Vision4Press platform.
Data correspond to usage on the plateform after 2015. The current usage metrics is available 48-96 hours after online publication and is updated daily on week days.
Initial download of the metrics may take a while.