Fig. 4.
Download original image
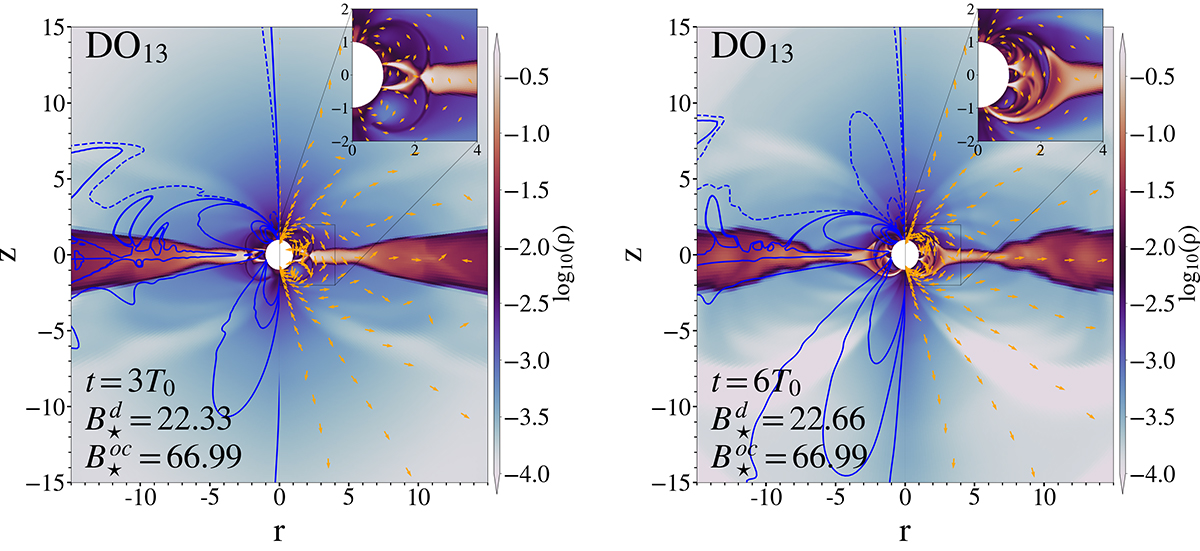
Temporal evolution of the gas density (in logarithmic scale in units of ρ0) for the model DO13. Left panel : Time t = 3T0. Right panel: Time t = 6T0. The streamlines of the angular momentum fluxes (fB) carried by the magnetic field are represented by the blue lines in the left side of each panel. On the right sides the velocity vectors are shown with yellow arrows. The inserts show a zoomed-in view of a region of the density maps where R < Rco.
Current usage metrics show cumulative count of Article Views (full-text article views including HTML views, PDF and ePub downloads, according to the available data) and Abstracts Views on Vision4Press platform.
Data correspond to usage on the plateform after 2015. The current usage metrics is available 48-96 hours after online publication and is updated daily on week days.
Initial download of the metrics may take a while.