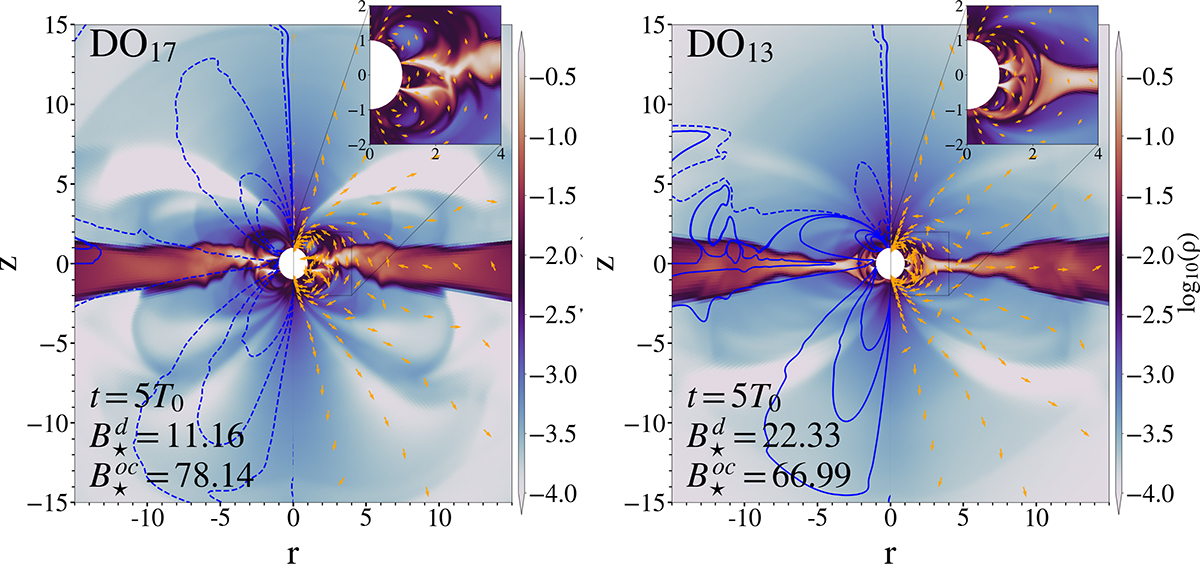
Fig. 5.
Download original image
Gas density comparison between dipolar plus octupolar models in logarithmic scale in units of ρ0 at t = 5T0. Left panel: Model DO17. Right panel: Model DO13. The blue lines and inserts are the same as in Fig. 4. The gas flow is compared at t = 5T0, when a quasi-steady state has been reached in the mixed dipolar–octupolar configurations.
Current usage metrics show cumulative count of Article Views (full-text article views including HTML views, PDF and ePub downloads, according to the available data) and Abstracts Views on Vision4Press platform.
Data correspond to usage on the plateform after 2015. The current usage metrics is available 48-96 hours after online publication and is updated daily on week days.
Initial download of the metrics may take a while.