Fig. 2
Download original image
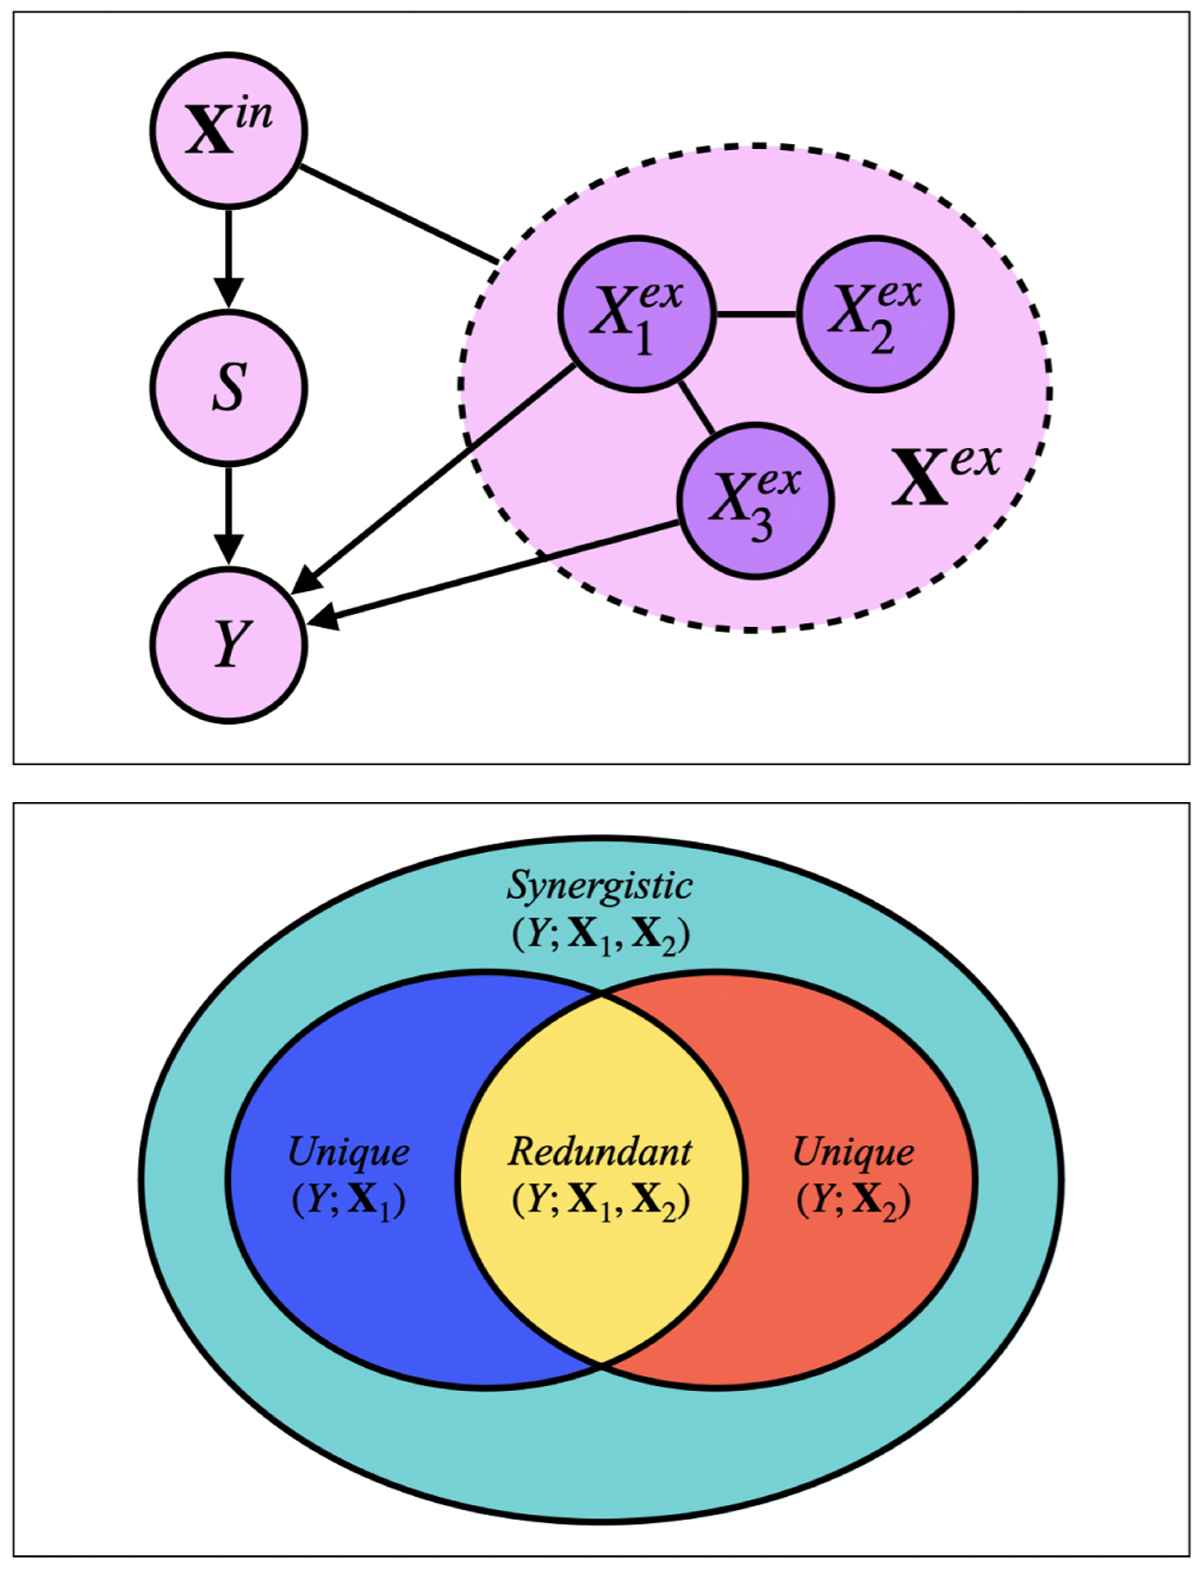
Causal analysis and mutual information decomposition methods adopted in this work. Upper panel: causal graph that represents the stellar mass-predicting process of an end-to-end deep learning model. Each node refers to a variable or a set of variables. Each arrow represents a causal link. Xin refers to the set of input data to the model. Y refers to the target variable (i.e., stellar mass in this work). Xex refers to the set of external variables that contain the information on stellar mass but missing in the input data. S refers to the low-dimensional latent vector that encodes the information on stellar mass extracted from the input data, the intermediary variable between Xin and Y. The line between Xex and Xin that has no direction specified refers to their possible dependence, which is not necessarily a direct causal link. There may be inner structures between the individual variables in the set Xex and Y, shown by the exemplar variables ![]() ,
, ![]() , and
, and ![]() . The undirected lines between
. The undirected lines between ![]() and
and ![]() and between
and between ![]() and
and ![]() refer to their possible undirected dependences. Lower panel: diagram of the decomposition of mutual information between the target Y and two sets of input data X1, X2. Redundant(Y; X1, X2) refers to the redundant information on Y that both X1 and X2 can provide. Unique(Y; X1) and Unique(Y; X2) refer to the unique information that only X1 or X2 can provide. S ynergistic(Y; X1, X2) refers to the synergistic information that exists only when both X1 and X2 are available.
refer to their possible undirected dependences. Lower panel: diagram of the decomposition of mutual information between the target Y and two sets of input data X1, X2. Redundant(Y; X1, X2) refers to the redundant information on Y that both X1 and X2 can provide. Unique(Y; X1) and Unique(Y; X2) refer to the unique information that only X1 or X2 can provide. S ynergistic(Y; X1, X2) refers to the synergistic information that exists only when both X1 and X2 are available.
Current usage metrics show cumulative count of Article Views (full-text article views including HTML views, PDF and ePub downloads, according to the available data) and Abstracts Views on Vision4Press platform.
Data correspond to usage on the plateform after 2015. The current usage metrics is available 48-96 hours after online publication and is updated daily on week days.
Initial download of the metrics may take a while.