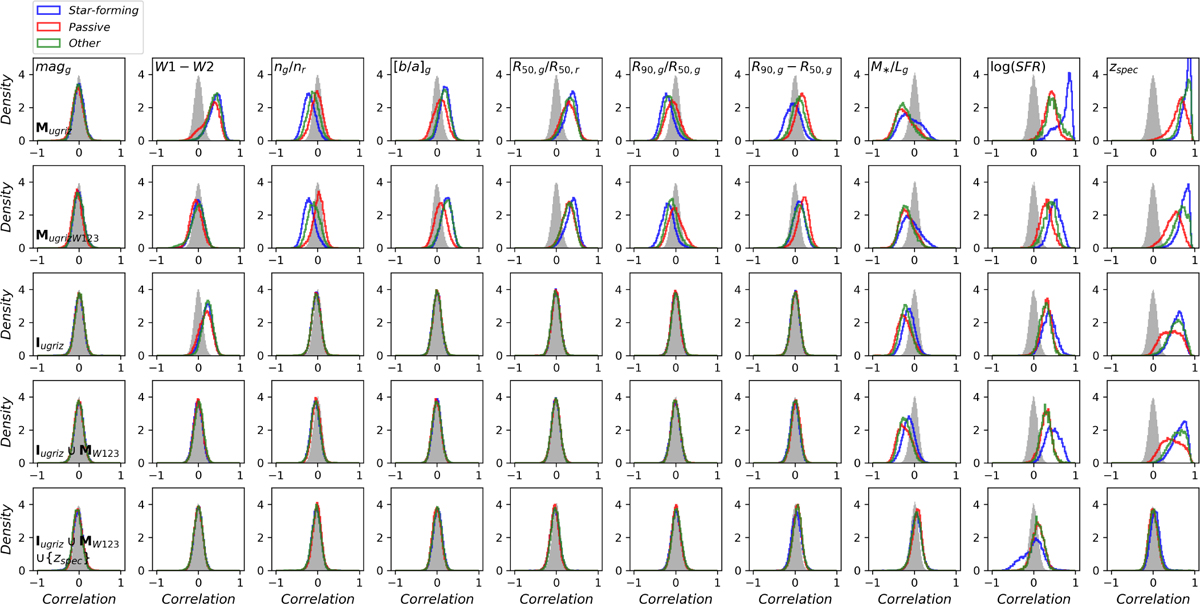
Fig. 3
Download original image
Distributions of local correlations between stellar mass and representative parameters for the five photometry-only or image-based models defined in Table 2. Each column corresponds a parameter, and each row corresponds to a model. The original distributions are separately shown for star-forming, passive, and other galaxies from the test sample, illustrated as the colored curves. The distributions shown in grey are used as a contrast, produced by randomly permuting the stellar mass values within the nearest neighbors of each test galaxy. Deviations between the original and reference correlation distributions indicate external parameters for a given model. Primarily, optical photometry cannot entirely account for morphological information, infrared information, spec-ɀ, and physical information related to stellar mass; while multi-band images can encompass intra- and cross-band morphological features that are both important for the stellar mass estimation.
Current usage metrics show cumulative count of Article Views (full-text article views including HTML views, PDF and ePub downloads, according to the available data) and Abstracts Views on Vision4Press platform.
Data correspond to usage on the plateform after 2015. The current usage metrics is available 48-96 hours after online publication and is updated daily on week days.
Initial download of the metrics may take a while.