Fig. 4
Download original image
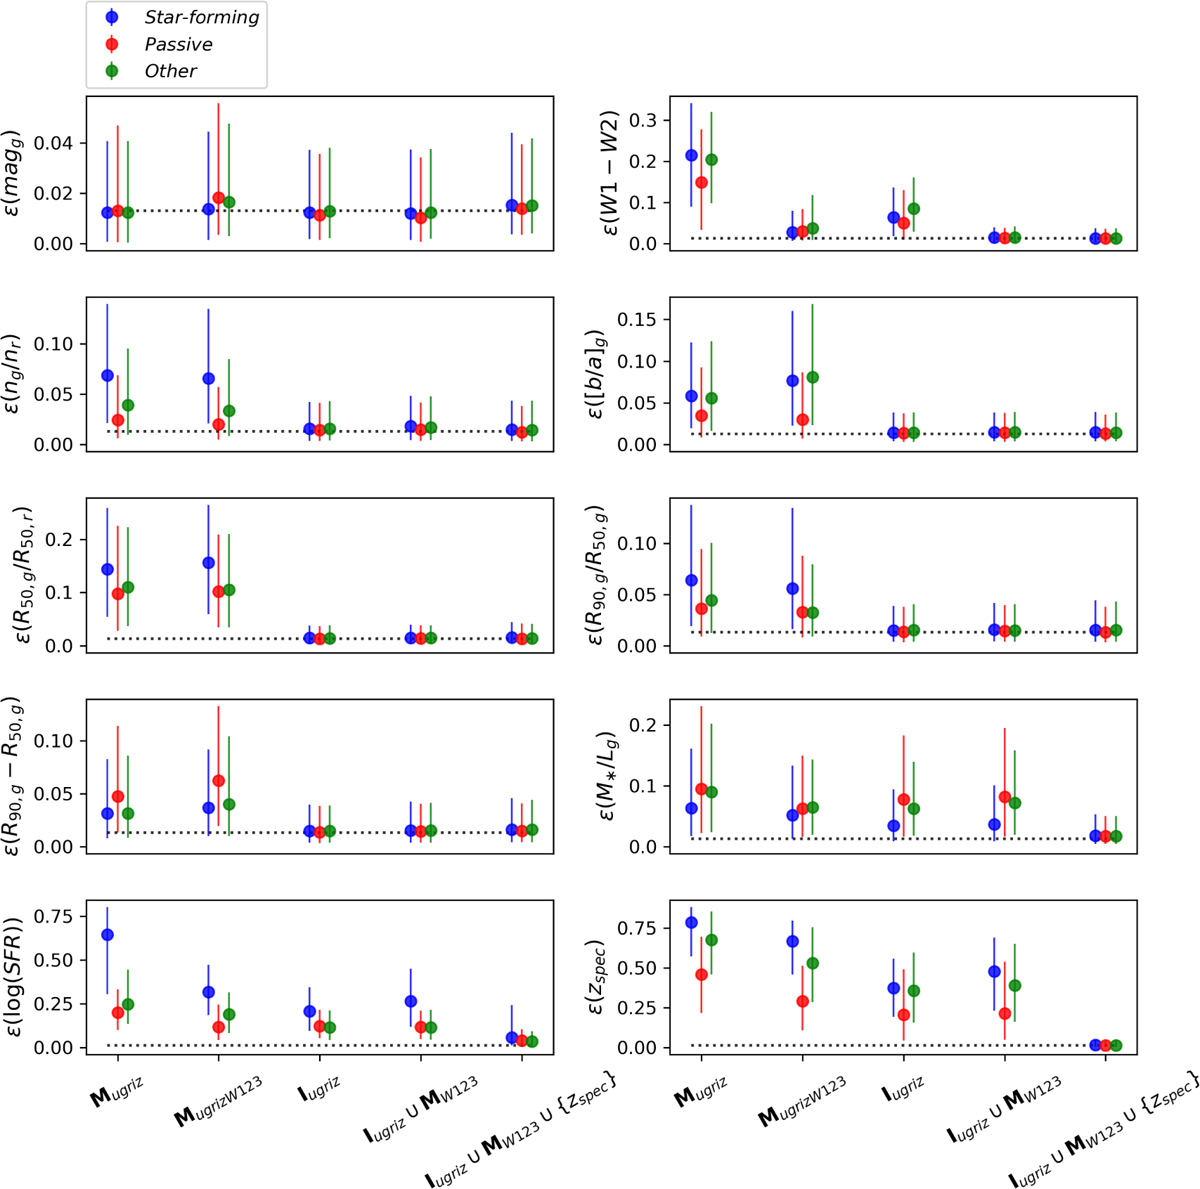
Predictive efficiency of representative parameters for the five photometry-only or image-based models defined in Table 2. Each data point corresponds to the 50th of the predictive efficiency distribution over a galaxy population from the test sample (i.e., star-forming, passive, and other galaxies), and each error bar indicates the 16th and 84th percentiles. The black dotted lines indicate the reference value of the median predictive efficiency (~0.013) estimated by randomly permuting the stellar mass values within the nearest neighbors of each test galaxy. The predictive efficiency reveals the same trends as in Fig. 3, and is more indicative of the impact of each variable on the stellar mass estimation.
Current usage metrics show cumulative count of Article Views (full-text article views including HTML views, PDF and ePub downloads, according to the available data) and Abstracts Views on Vision4Press platform.
Data correspond to usage on the plateform after 2015. The current usage metrics is available 48-96 hours after online publication and is updated daily on week days.
Initial download of the metrics may take a while.