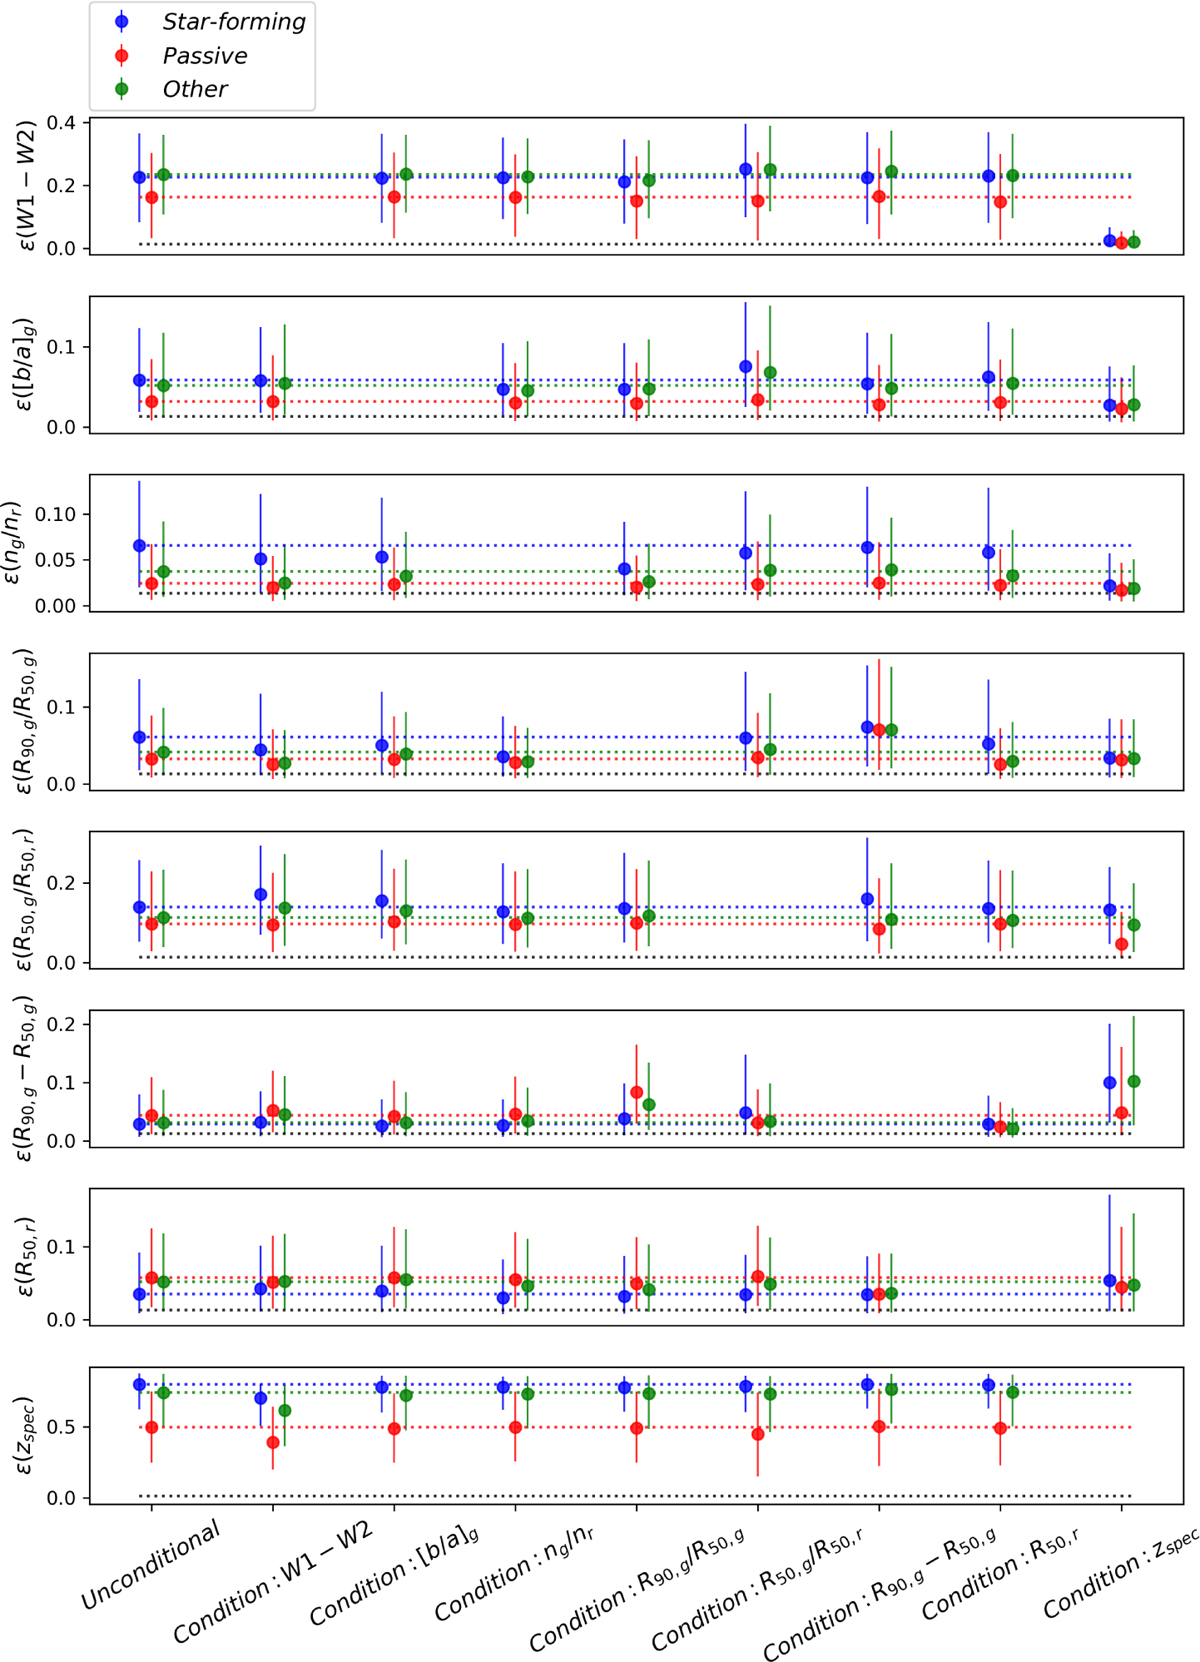
Fig. 5
Download original image
Conditional predictive efficiency of representative parameters for the photometry-only model Mu𝑔riz defined in Table 2. Each data point corresponds to the 50th of the (conditional) predictive efficiency distribution over a galaxy population from the test sample (i.e., star-formin𝑔, passive, and other galaxies), and each error bar indicates the 16th and 84th percentiles. In each row (corresponding to a parameter), the first triplet of data points shows the unconditional predictive efficiency to be compared with, and each of the remaining triplets shows the conditional predictive efficiency with the conditional variable labeled on the bottom. All the parameters including stellar mass are first conditioned on the 𝑔 − r color of the nearest neighbors of each test galaxy before computing the (conditional) predictive efficiency. The black dotted lines indicate the reference value of the median predictive efficiency (~0.013) estimated by randomly permuting the stellar mass values within the nearest neighbors of each test galaxy. For better comparison, the blue, red, and green dotted lines indicate the three 50th percentiles (corresponding to the three galaxy populations) for the unconditional predictive efficiency. Based on the contrast between the conditional and unconditional predictive efficiency values, we mainly see that the contributions of W1 − W2, [b/a]𝑔, n𝑔/nr, and R90,𝑔/R50,𝑔 to the stellar mass estimation can be largely explained by spec-ɀ, whereas the contributions of the other parameters such as R50,𝑔/R50,r for star-forming galaxies is essentially unexplained by spec-ɀ. Furthermore, the contributions of all the morphological parameters cannot be fully explained by W1 − W2, and vice versa.
Current usage metrics show cumulative count of Article Views (full-text article views including HTML views, PDF and ePub downloads, according to the available data) and Abstracts Views on Vision4Press platform.
Data correspond to usage on the plateform after 2015. The current usage metrics is available 48-96 hours after online publication and is updated daily on week days.
Initial download of the metrics may take a while.