Fig. 8
Download original image
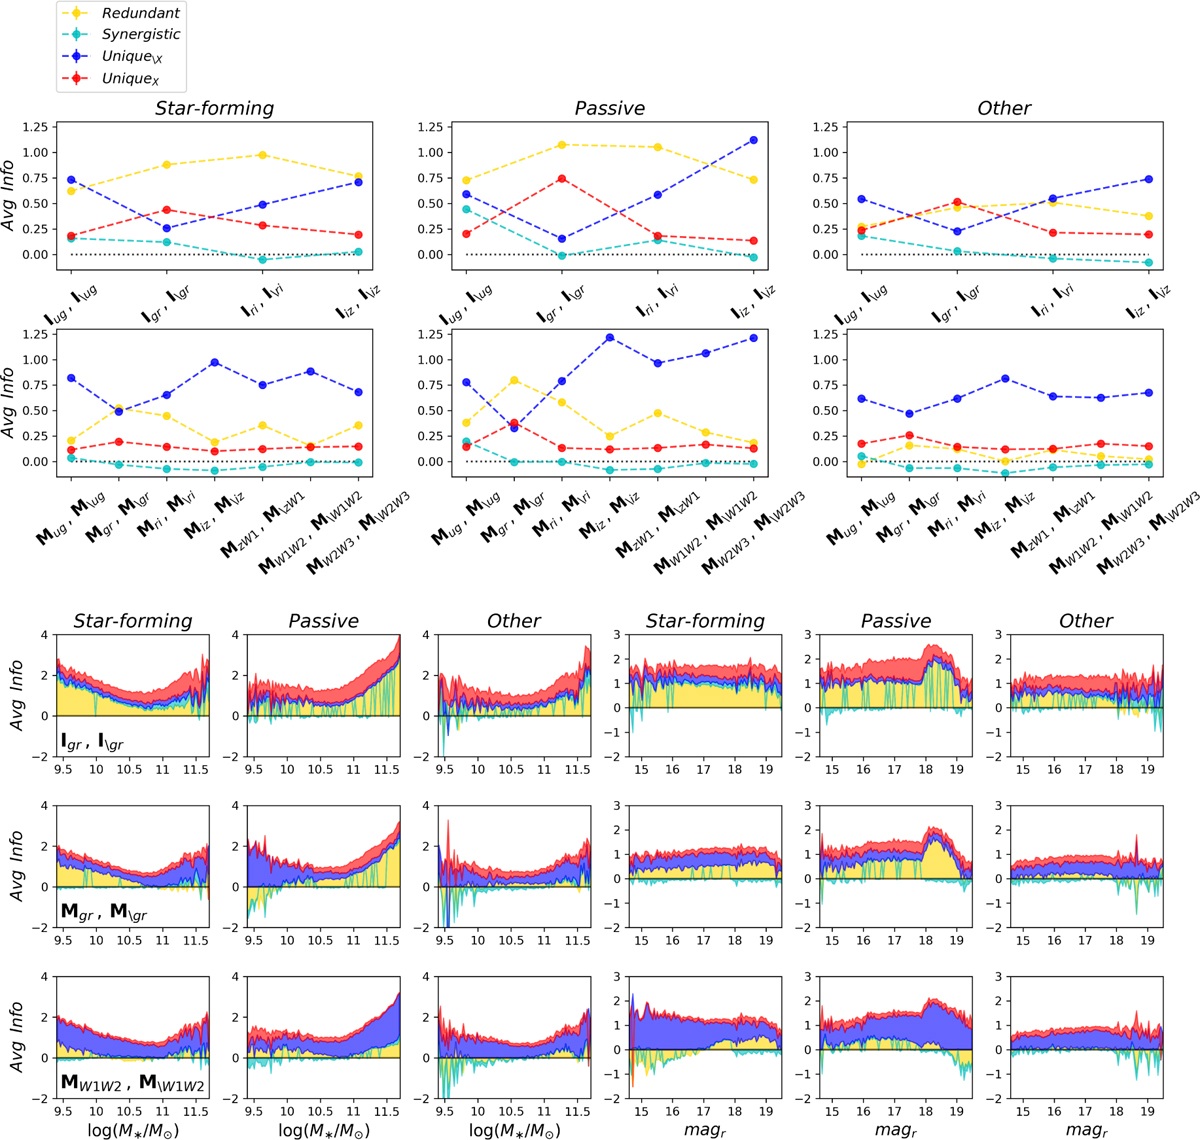
Same as Fig. 7, but with two adjacent bands separated out in each case. Compared to the cases with one single band, more information can generally be provided by two bands, in particular 𝑔-band and r-band images that have the strongest synergistic effect. The behaviors of data imbalance are revealed in the stack plots that are illustrated for separating out both the 𝑔 and r bands, or both the W1 and W2 bands.
Current usage metrics show cumulative count of Article Views (full-text article views including HTML views, PDF and ePub downloads, according to the available data) and Abstracts Views on Vision4Press platform.
Data correspond to usage on the plateform after 2015. The current usage metrics is available 48-96 hours after online publication and is updated daily on week days.
Initial download of the metrics may take a while.