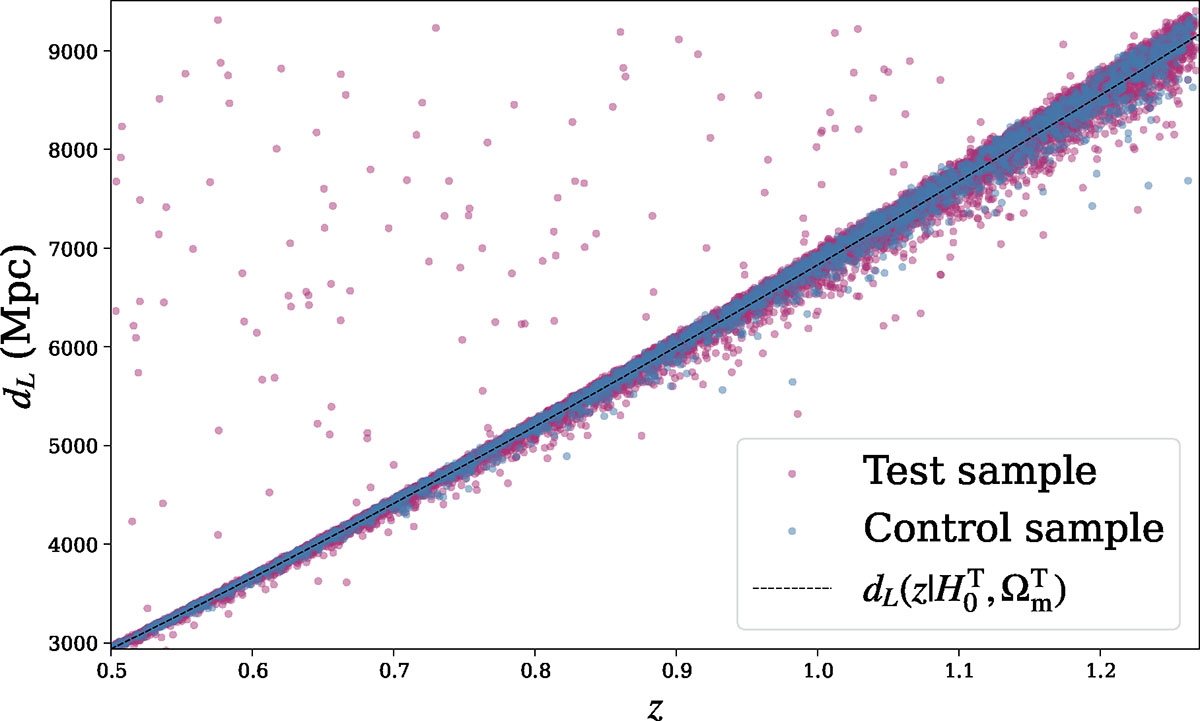
Fig. 8.
Download original image
Hubble diagram constructed from two different SNe samples: In the case shown in blue, all SNe are correctly matched to their respective host galaxies. In contrast, in the case shown in purple, the host galaxies were matched to each SNe Ia with the algorithm described in Section 2.3. The dashed dL(z) curve was computed with the parameters fitted from the sample where all SNe Ia are correctly matched to their host galaxies. We see by comparison that the SNe for which the host galaxy has been misidentified are scattered across the upper left region of the plot, shifted horizontally to lower z along a line of constant dL.
Current usage metrics show cumulative count of Article Views (full-text article views including HTML views, PDF and ePub downloads, according to the available data) and Abstracts Views on Vision4Press platform.
Data correspond to usage on the plateform after 2015. The current usage metrics is available 48-96 hours after online publication and is updated daily on week days.
Initial download of the metrics may take a while.