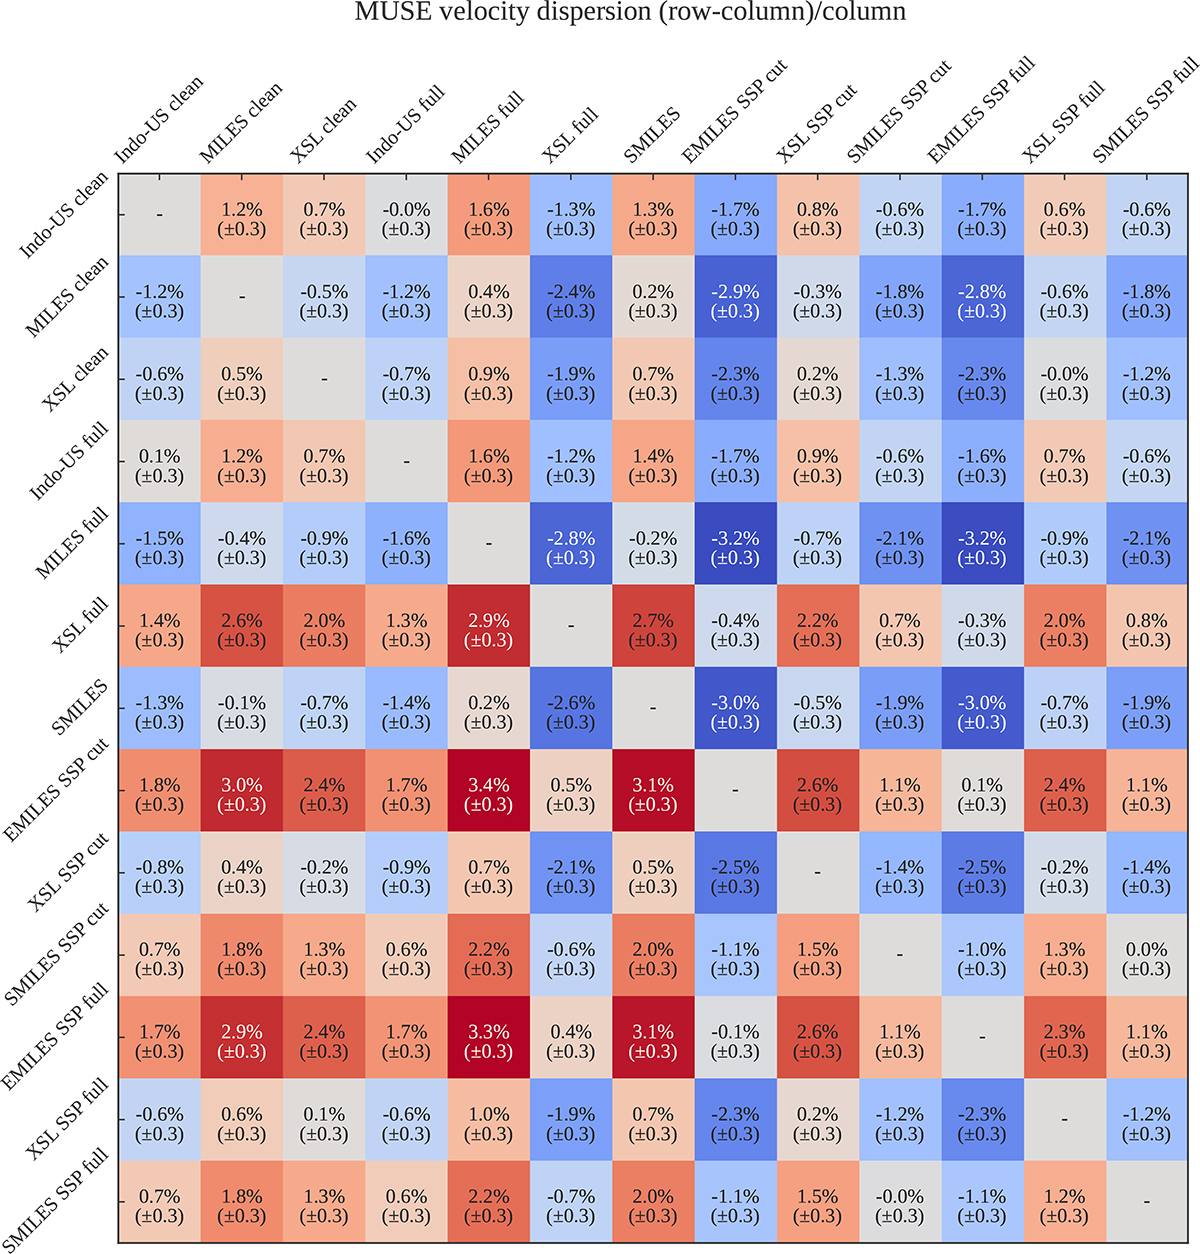
Fig. 10.
Download original image
Comparison of velocity dispersion measurements of the MUSE sample using a range of template libraries. For every pair of libraries, the heat map shows the relative difference in the inferred stellar velocity dispersion, averaged across the sample. The uncertainty is estimated by bootstrap resampling the galaxies. Blue (red) boxes represent pairs in which the library listed on the row yields a lower (higher) value than that listed on the column. The wavelength range is 3600–4500 Å. Comparisons for the KCWI, SDSS, and JWST/NIRSpec samples are shown in Figures A.1–A.3.
Current usage metrics show cumulative count of Article Views (full-text article views including HTML views, PDF and ePub downloads, according to the available data) and Abstracts Views on Vision4Press platform.
Data correspond to usage on the plateform after 2015. The current usage metrics is available 48-96 hours after online publication and is updated daily on week days.
Initial download of the metrics may take a while.