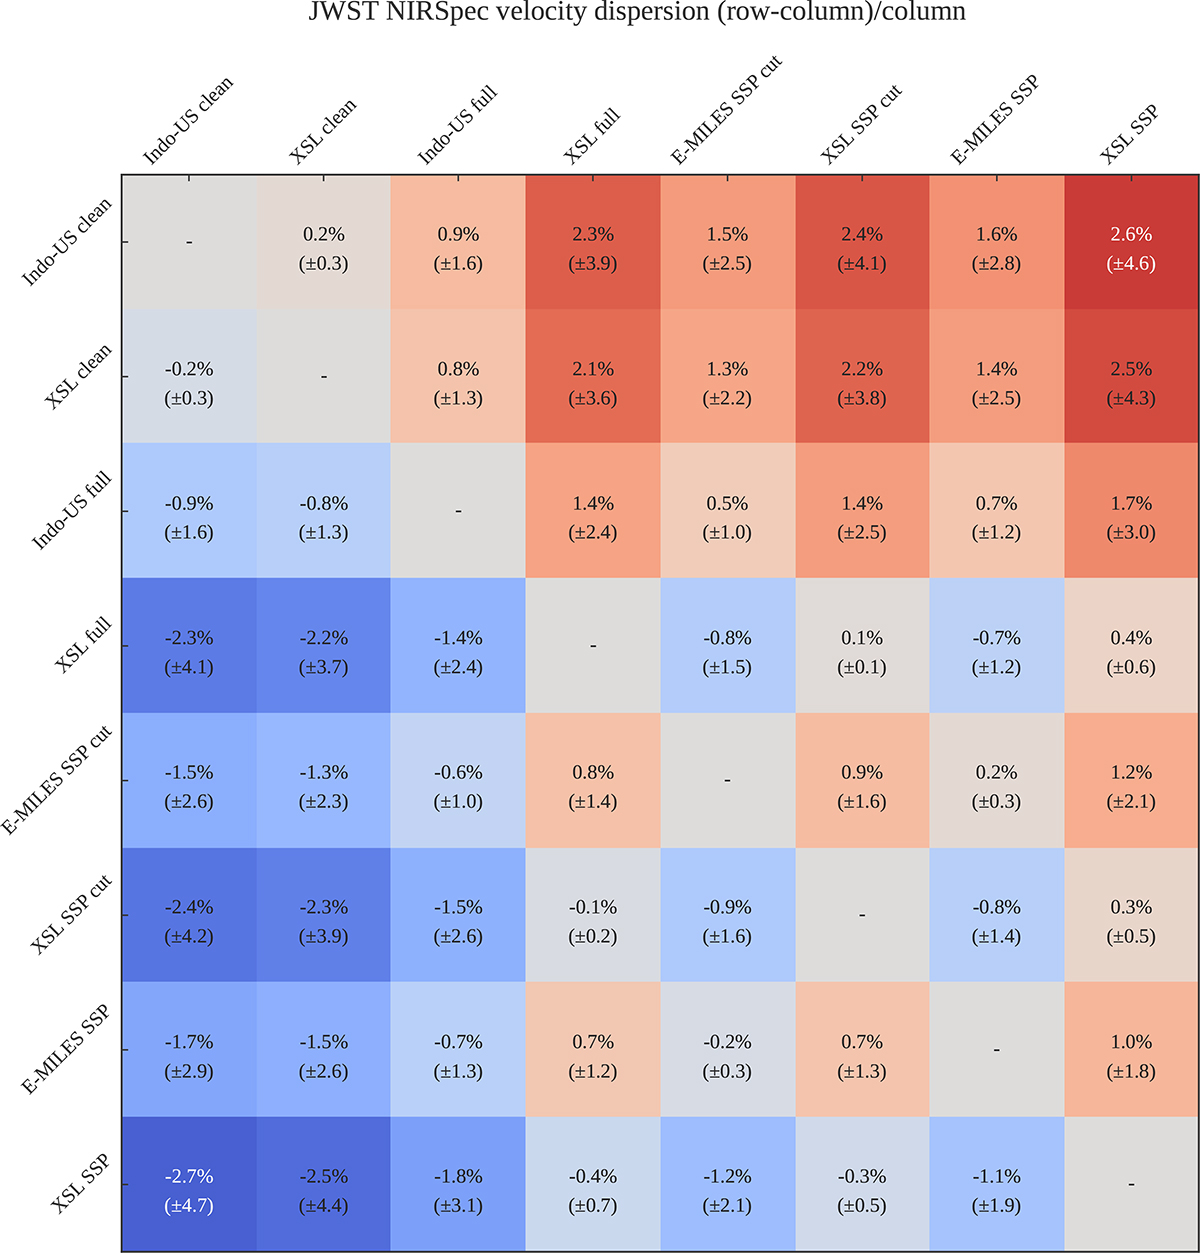
Fig. A.3.
Download original image
Comparison of velocity dispersion measurements for the JWST/NIRSpec spectra for RXJ1131−1231. The differences in the measured dispersions are averaged over 21 spaxels within a 0![]() 5×0
5×0![]() 5 square at the center of the lens galaxy. This figure is in the same format as Figure 10, except that fewer libraries are shown, only the ones that include the wavelength region of the Ca II triplet used to fit the JWST/NIRSpec data.
5 square at the center of the lens galaxy. This figure is in the same format as Figure 10, except that fewer libraries are shown, only the ones that include the wavelength region of the Ca II triplet used to fit the JWST/NIRSpec data.
Current usage metrics show cumulative count of Article Views (full-text article views including HTML views, PDF and ePub downloads, according to the available data) and Abstracts Views on Vision4Press platform.
Data correspond to usage on the plateform after 2015. The current usage metrics is available 48-96 hours after online publication and is updated daily on week days.
Initial download of the metrics may take a while.