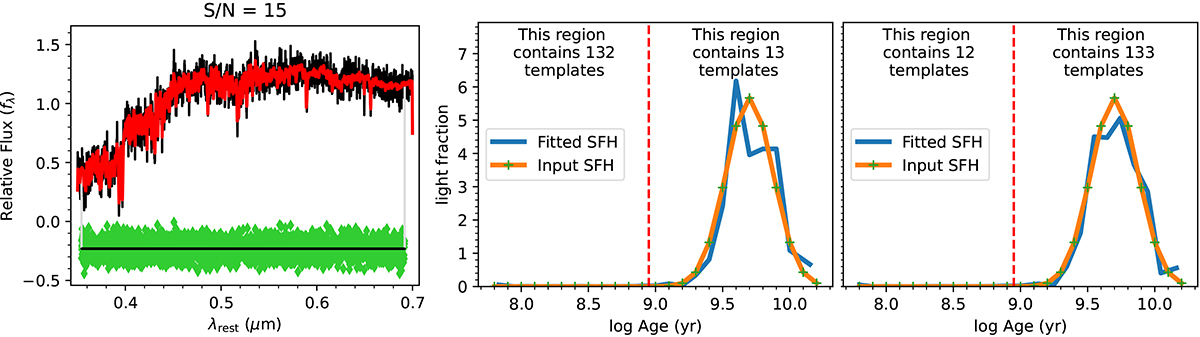
Fig. 3.
Download original image
Test of the robustness of the spectral fit to the template distribution, as described in Section 2.3. The left panel shows a representative pPXF fit to the mock spectrum, showing the data (black), best-fit model (red), and residuals (green diamonds). The fits for the two biased library cases are indistinguishable, except for different random noise realizations. The middle and right panels show the input SFH (orange) and the averaged recovered pPXF SFH (blue) of 100 Monte Carlo realizations for the cases with template libraries overpopulated at young and old ages, respectively. The recovered SFHs are statistically indistinguishable, demonstrating the robustness of the method.
Current usage metrics show cumulative count of Article Views (full-text article views including HTML views, PDF and ePub downloads, according to the available data) and Abstracts Views on Vision4Press platform.
Data correspond to usage on the plateform after 2015. The current usage metrics is available 48-96 hours after online publication and is updated daily on week days.
Initial download of the metrics may take a while.