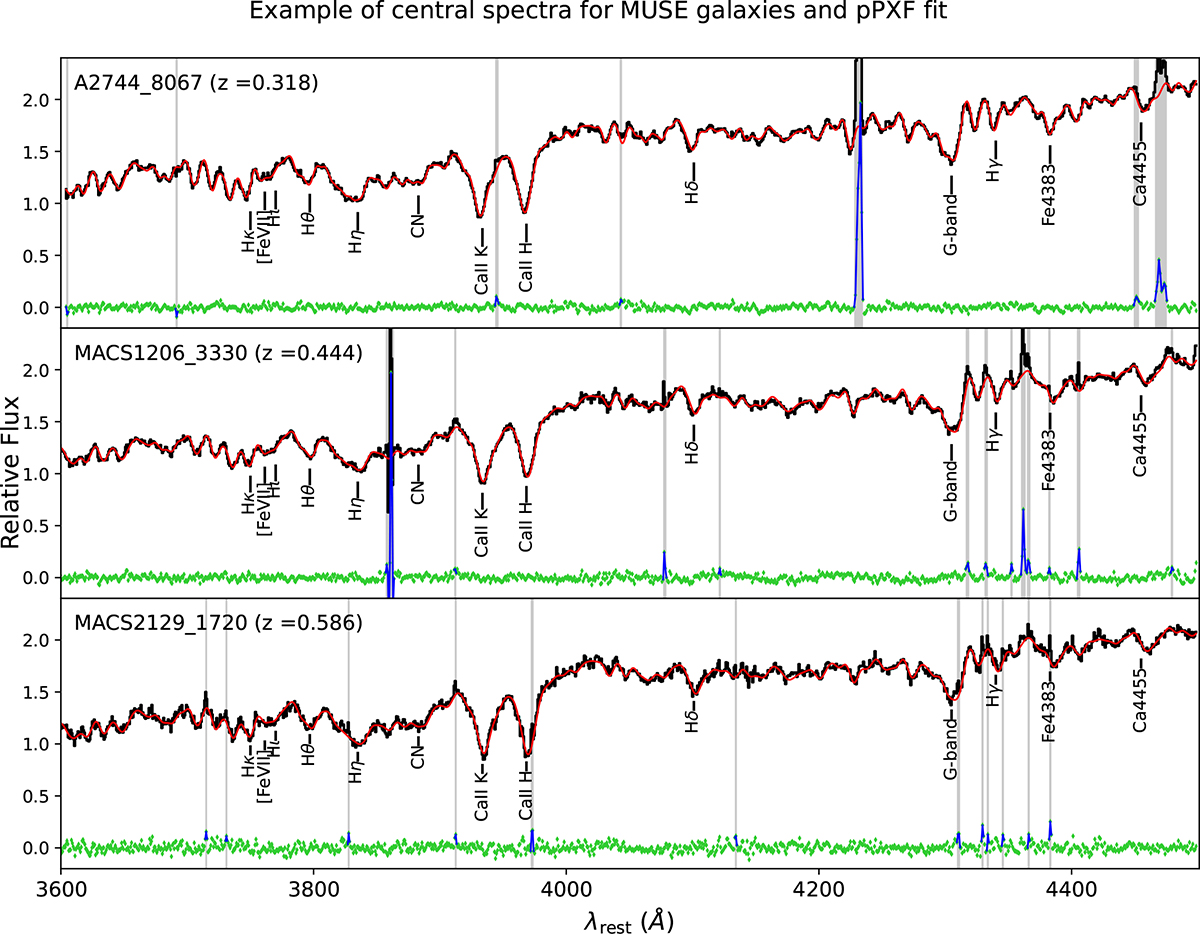
Fig. 4.
Download original image
1D spectra extracted from central spaxels of three galaxies from the MUSE sample at different redshifts. In each panel, the black line is the observed spectrum and the red line is the best-fit model from pPXF. The gray regions mark the excluded wavelength range from fitting, and the green markers are residuals between data and the fitted model at each wavelength. The blue pixels, generally emission lines or sky residuals, have been excluded by sigma-clipping.
Current usage metrics show cumulative count of Article Views (full-text article views including HTML views, PDF and ePub downloads, according to the available data) and Abstracts Views on Vision4Press platform.
Data correspond to usage on the plateform after 2015. The current usage metrics is available 48-96 hours after online publication and is updated daily on week days.
Initial download of the metrics may take a while.