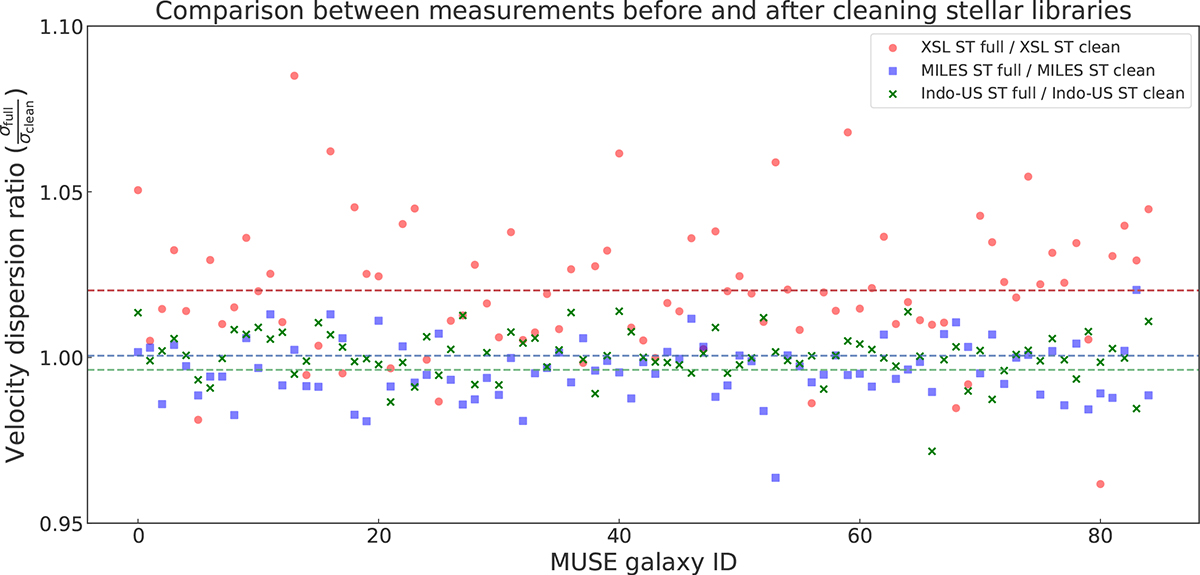
Fig. 8.
Download original image
Ratio of velocity dispersion measurements between “full” and “clean” XSL (red), MILES (blue), and Indo-US (green) libraries. The markers denote the ratio of the velocity dispersion measurements for individual galaxies in the MUSE sample and the horizontal dashed lines mark the sample average for each library. While the effect of cleaning the libraries is most prominent for XSL, it is evident that this is a crucial process in achieving high accuracy.
Current usage metrics show cumulative count of Article Views (full-text article views including HTML views, PDF and ePub downloads, according to the available data) and Abstracts Views on Vision4Press platform.
Data correspond to usage on the plateform after 2015. The current usage metrics is available 48-96 hours after online publication and is updated daily on week days.
Initial download of the metrics may take a while.