Fig. 10.
Download original image
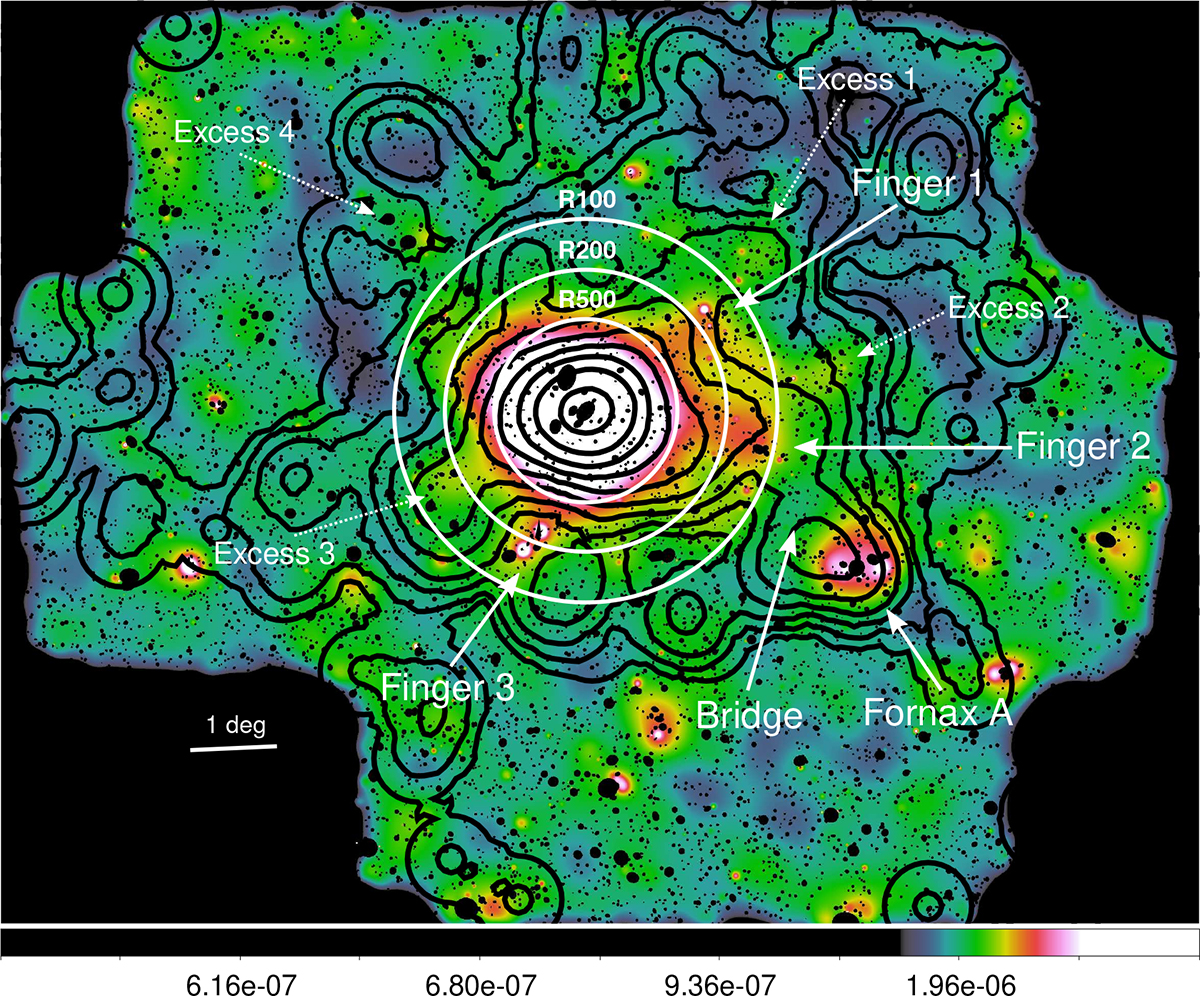
Same as Fig. 2 but also showing density contours of galaxies at the Fornax cluster redshift from NED. Notice the overdensity of member galaxies in several of the regions of increased X-ray surface brightness in the outskirts, in particular to the west and southeast (i.e., the fingers and excesses) as well as the emission bridge to the Fornax A galaxy group.
Current usage metrics show cumulative count of Article Views (full-text article views including HTML views, PDF and ePub downloads, according to the available data) and Abstracts Views on Vision4Press platform.
Data correspond to usage on the plateform after 2015. The current usage metrics is available 48-96 hours after online publication and is updated daily on week days.
Initial download of the metrics may take a while.