Fig. 3
Download original image
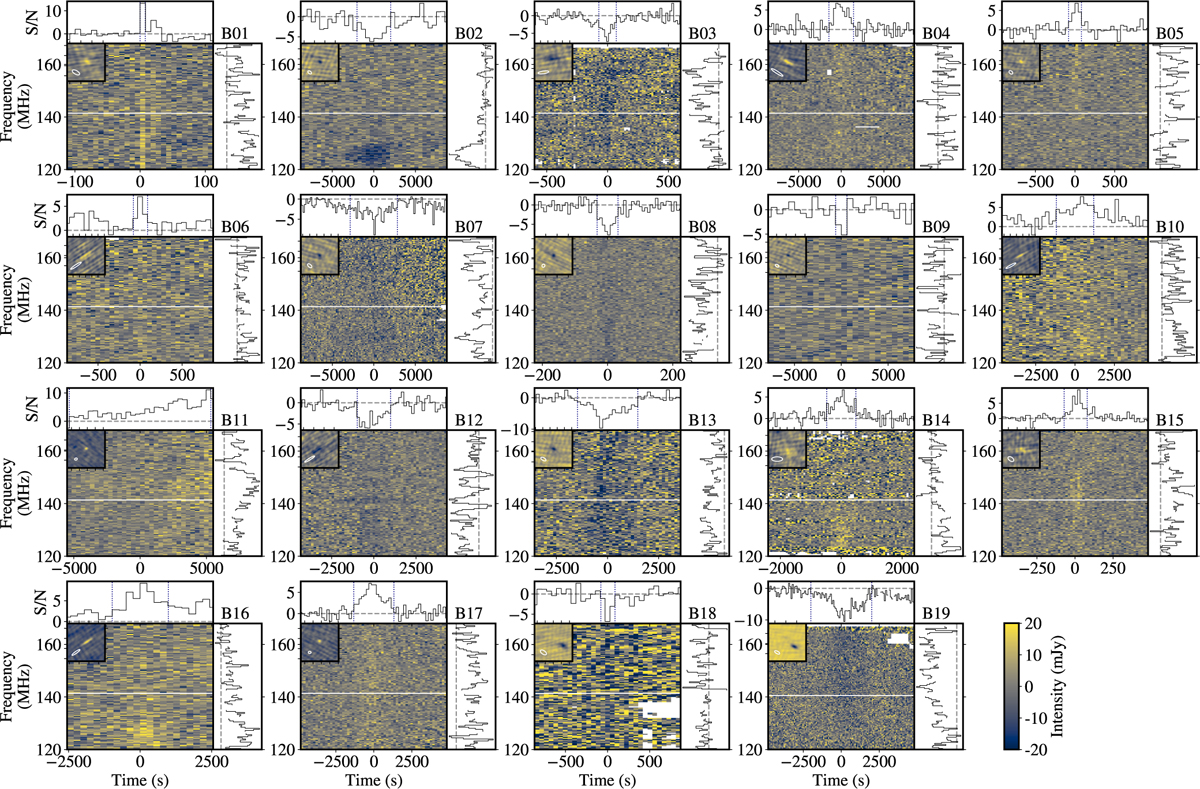
The 19 stellar radio bursts detected without drifting features. Each thumbnail shows a dynamic spectrum (Δν=0.4 MHz, Δt= the boxcar width). The interferometric images are shown as insets in the top left. The time series of the inverse variance weighted frequency-integrated spectra are shown at the top of each panel, with vertical dotted lines indicating the start and end times of the burst. The time-integrated spectra (shown to the right of each panel) are integrated over the time range indicated by the vertical dotted blue lines in the time series. Denoted in the top right of each thumbnail is the burst ID, which corresponds to Table 1. White areas in the dynamic spectra represent areas masked due to the presence of RFI, and the white ovals in the interferometric image represent the point spread function. For visual purposes, the colour maps of the dynamic spectra range from −20 to 20 mJy. Bursts B02, B04, B10, B11, B12, B14, B16, B17, and B20 are also presented in Tasse et al. (2025).
Current usage metrics show cumulative count of Article Views (full-text article views including HTML views, PDF and ePub downloads, according to the available data) and Abstracts Views on Vision4Press platform.
Data correspond to usage on the plateform after 2015. The current usage metrics is available 48-96 hours after online publication and is updated daily on week days.
Initial download of the metrics may take a while.