Fig. 4
Download original image
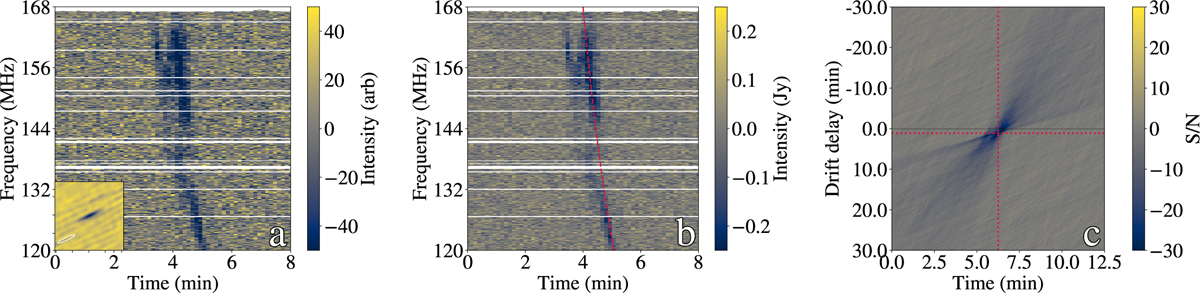
Panel a: dynamic spectrum of B20 normalised by the blank-sky variances. The inset in the bottom left displays an interferometric image indicating that the emission originates from a point source. The horizontal white bands are frequency channels masked due to the presence of RFI. Panel b: dynamic spectrum of B20, with the highest likelihood drift rate (i.e. the overall drift rate) shown as a dashed red line. Panel c: frequency-integrated burst brightness as a function of the modelled drift delay. The intersection of the dotted red lines indicates the location of the highest S/N at ~1 minute; the horizontal line represents zero drift and corresponds to the original time series.
Current usage metrics show cumulative count of Article Views (full-text article views including HTML views, PDF and ePub downloads, according to the available data) and Abstracts Views on Vision4Press platform.
Data correspond to usage on the plateform after 2015. The current usage metrics is available 48-96 hours after online publication and is updated daily on week days.
Initial download of the metrics may take a while.