Fig. 5
Download original image
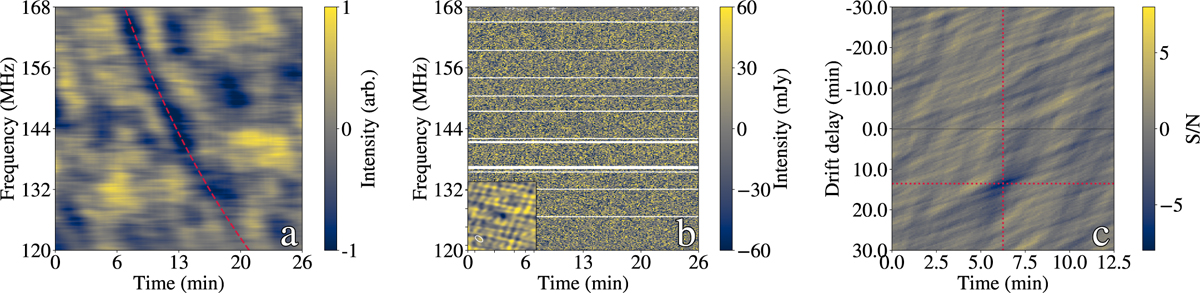
Panel a: dynamic spectrum of B21 convolved with a kernel designed to follow the burst’s drift pattern. The drift of the burst is overplotted as a dotted red line. Panel b: raw dynamic spectrum of B21. The horizontal white bands are frequency channels masked due to the presence of RFI. The inset in the bottom left shows an interferometric image reconstructed along the dotted line in panel a, indicating that the emission originates from a point source. Panel c: frequency-integrated burst brightness as a function of the modelled drift delay. The dotted cross indicates the location of the highest S/N at a drift of 13 minutes, where the burst aligns vertically and thus appears offset from the horizontal zero drift line, which corresponds to the original time series.
Current usage metrics show cumulative count of Article Views (full-text article views including HTML views, PDF and ePub downloads, according to the available data) and Abstracts Views on Vision4Press platform.
Data correspond to usage on the plateform after 2015. The current usage metrics is available 48-96 hours after online publication and is updated daily on week days.
Initial download of the metrics may take a while.