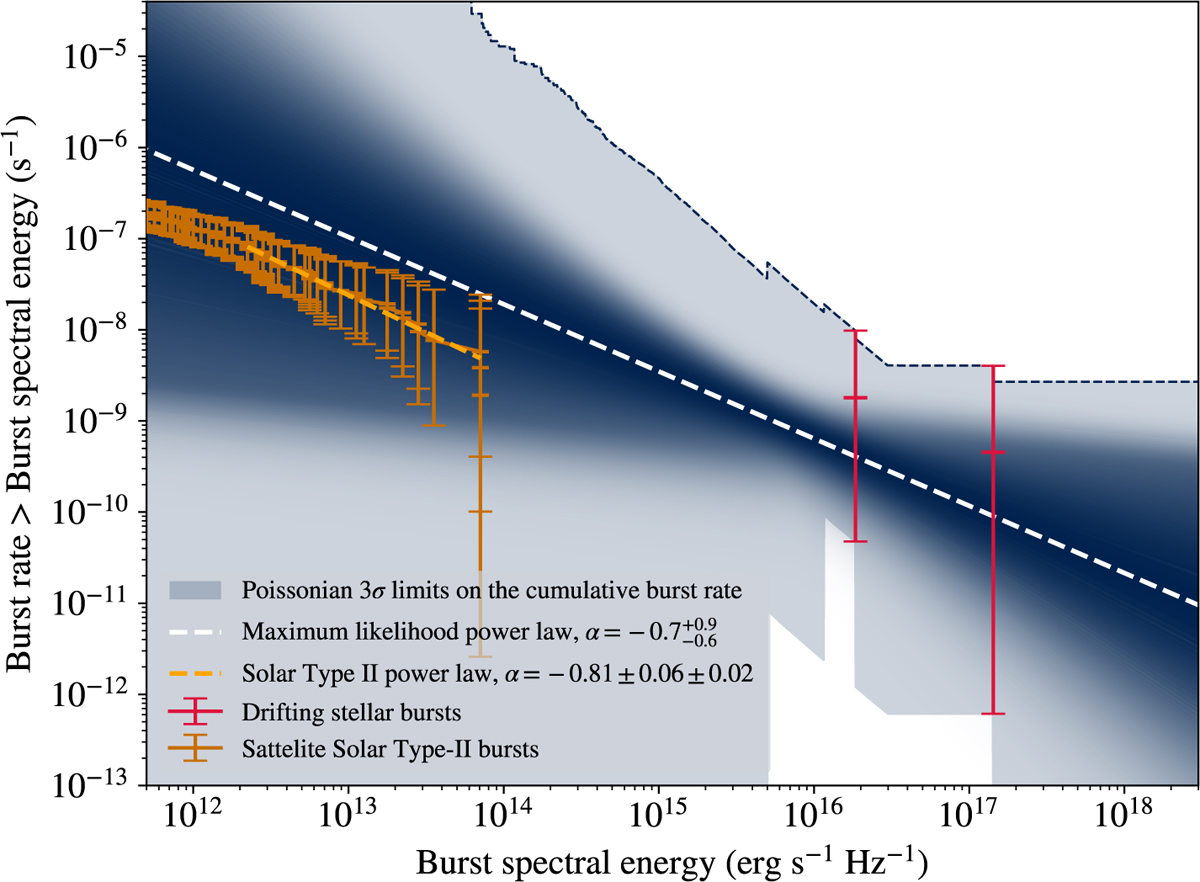
Fig. 6
Download original image
Burst rate of circularly polarised drifting stellar radio bursts that exceed a given spectral energy threshold (in erg s−1 Hz−1). The monochromatic grey area represents the region spanned by the 3σ Poissonian limits; the dark dashed line indicates the upper limit. The two red data points represent detected drifting bursts, which cause sudden jumps in the Poisson lower limit when specific energies reach the detection threshold for that star. For energies exceeding that of a drifting burst, the lower limit drops again due to insufficient data on higher-energy bursts. The dashed white line represents the maximum likelihood of the cumulative luminosity distribution, while the blue diverging shaded region shows other possible solutions, with faded colours indicating a lower likelihood. The cumulative spectral energy distribution of decametric solar Type II radio bursts, to which a power law has been fitted using the Python powerlaw package (Clauset et al. 2009), is plotted in orange.
Current usage metrics show cumulative count of Article Views (full-text article views including HTML views, PDF and ePub downloads, according to the available data) and Abstracts Views on Vision4Press platform.
Data correspond to usage on the plateform after 2015. The current usage metrics is available 48-96 hours after online publication and is updated daily on week days.
Initial download of the metrics may take a while.