Fig. 9
Download original image
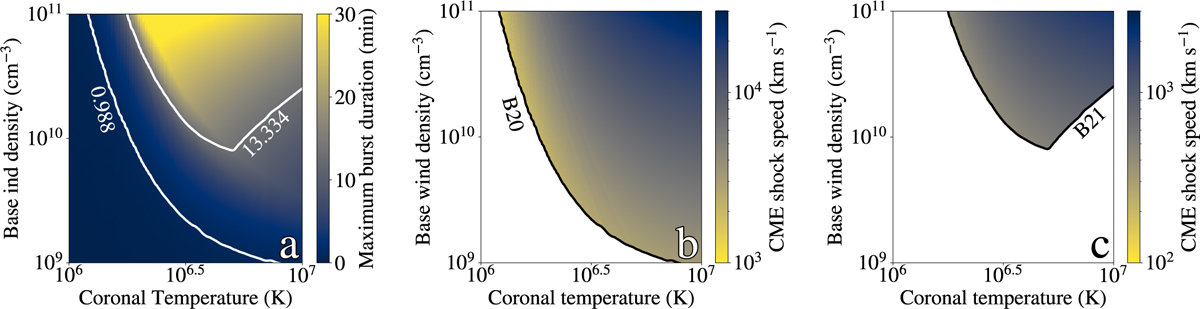
Panel a: maximum burst duration in minutes through our observing band (120–168 MHz) as a function of coronal temperature and base wind density, modelled with an iso-thermal Parker wind model. White contour lines show the observed durations of bursts B20 and B21. Regions above the contours can produce bursts with the observed durations, with CME shock speeds exceeding the wind- and Alfvén speed. Panel b: CME shock speeds that exactly produce burst B20’s observed duration of 0.988 minutes, as a function of coronal temperature and base wind density, modelled with an isothermal Parker wind model. The black line marks the minimum shock speed exceeding both the Alfvén and wind speeds. Solutions exist for shock speeds upwards of ~1000 km s−1. Panel c: CME shock speeds that exactly produce burst B21’s observed duration of 13.334 minutes, as a function of coronal temperature and base wind density, modelled with an isothermal Parker wind model. The black line marks the minimum shock speed exceeding both the Alfvén and wind speeds. Solutions exist for shock speeds upwards of ~300 km s−1.
Current usage metrics show cumulative count of Article Views (full-text article views including HTML views, PDF and ePub downloads, according to the available data) and Abstracts Views on Vision4Press platform.
Data correspond to usage on the plateform after 2015. The current usage metrics is available 48-96 hours after online publication and is updated daily on week days.
Initial download of the metrics may take a while.