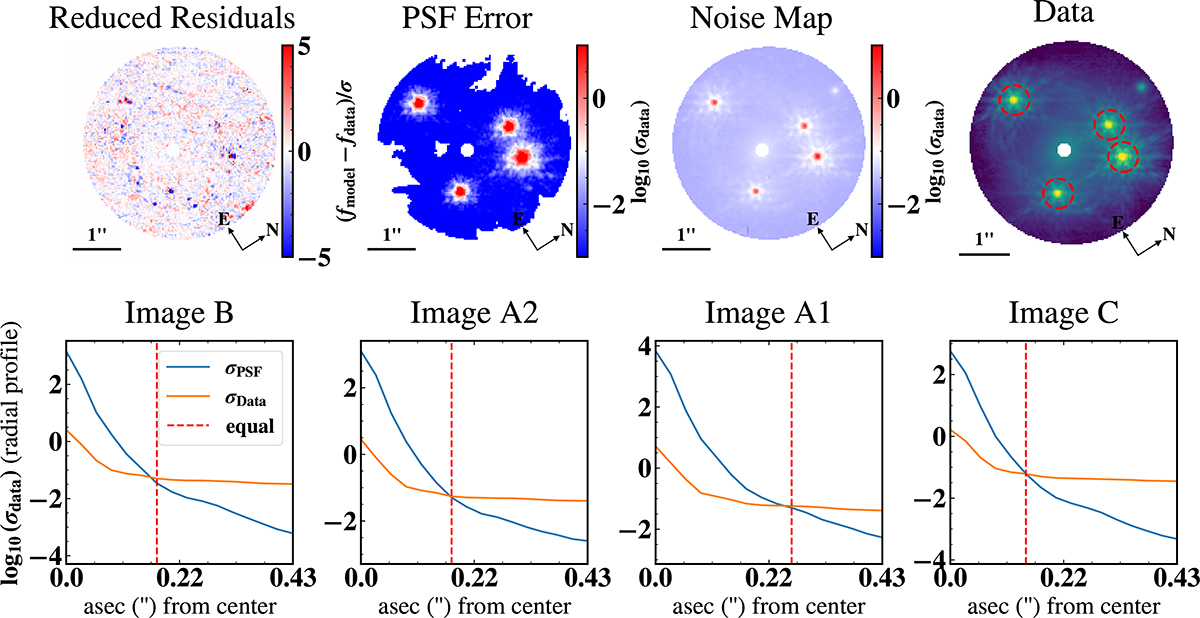
Fig. E.2.
Download original image
Radial breakdown of image uncertainty contributions between the noise directly in the data and the additional PSF uncertainty term, showing the PSF contribution does not down-weight the ring structure of the extended source. Top left: normalized residual map, same as Fig. E.1. Top middle left: error contributions from the PSF uncertainty alone, and top middle right shows only the uncertainty due to the data alone. These are combined to form the final map, shown in Fig. E.1. Top right: the imaging data used for modeling, with circles indicating the largest radial extent of the images where the PSF uncertainty equals the noise uncertainty. Shown on the bottom are the radial uncertainty contributions from the imaging data vs the estimated PSF error. We find the maximum extent at which the PSF error dominates the uncertainty is at a radius less than 11 pixels (≈0.338″), shown in the top right figure.
Current usage metrics show cumulative count of Article Views (full-text article views including HTML views, PDF and ePub downloads, according to the available data) and Abstracts Views on Vision4Press platform.
Data correspond to usage on the plateform after 2015. The current usage metrics is available 48-96 hours after online publication and is updated daily on week days.
Initial download of the metrics may take a while.