Fig. 5.
Download original image
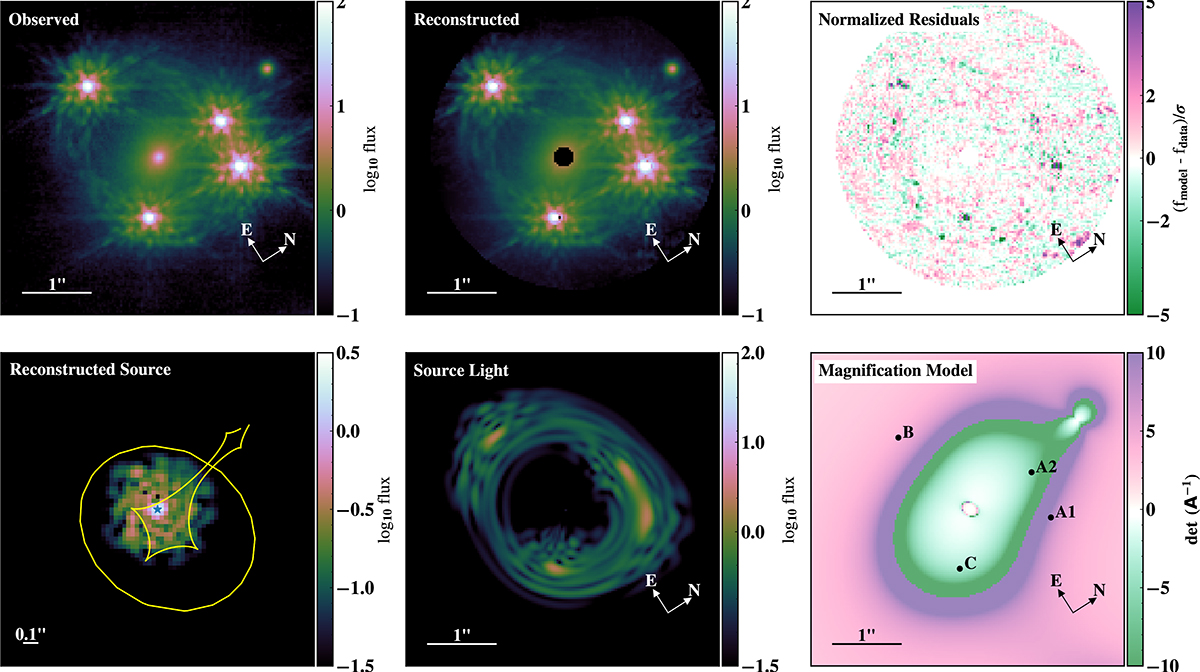
Example model output from the best performing model shown in Table D.1. We note that the other models are qualitatively indistinguishable. The top-left panel shows the observed image, the top-middle panel shows the model-predicted reconstruction of the image, and top-right panel shows the fit’s residuals normalized by the estimated uncertainty of each pixel (see Appendix E for more details). At the bottom left is the reconstructed source plot, featuring more detail than any parametric source modeled for time-delay cosmography thus far. The star symbol denotes the location of the quasar host galaxy’s centroid. The bottom-middle panel shows the lensed unconvolved extended-source light, and the bottom-right panel shows the magnification map of the system.
Current usage metrics show cumulative count of Article Views (full-text article views including HTML views, PDF and ePub downloads, according to the available data) and Abstracts Views on Vision4Press platform.
Data correspond to usage on the plateform after 2015. The current usage metrics is available 48-96 hours after online publication and is updated daily on week days.
Initial download of the metrics may take a while.