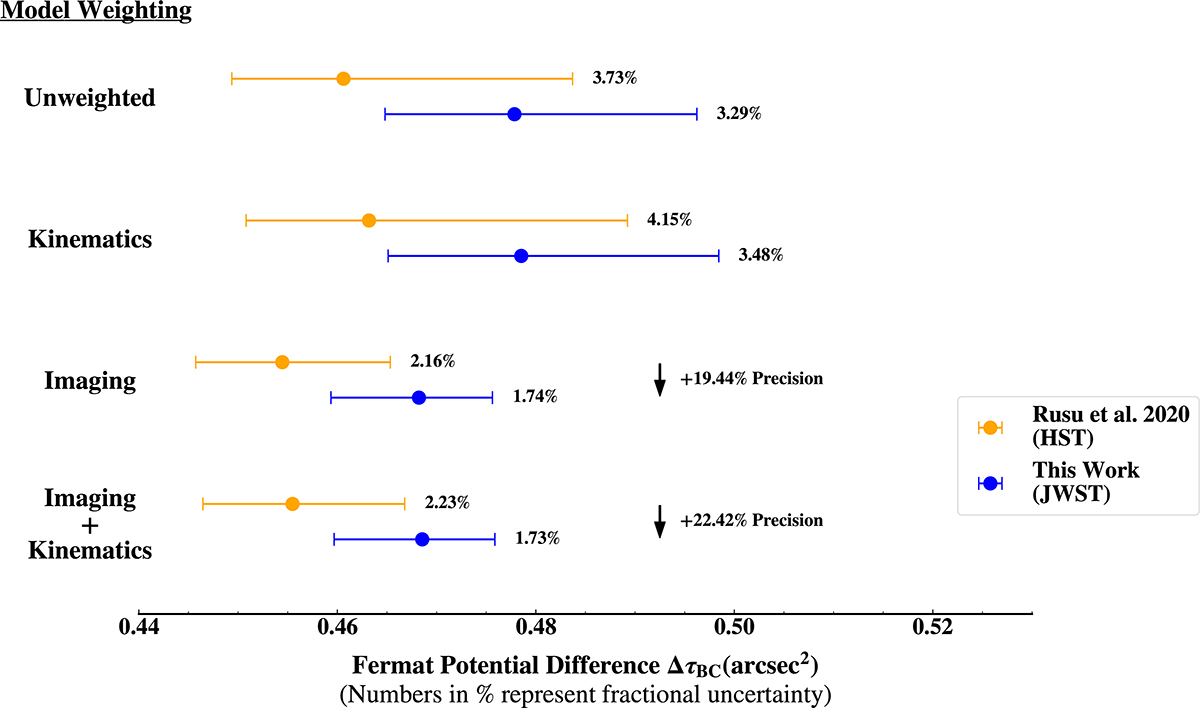
Fig. 6.
Download original image
Comparison of the Fermat potential differences of images B and C between the HST models (Rusu et al. 2020, orange) and this work (blue). The fractional uncertainty (measured as the standard deviation over the median) is given to the right of the measurements. Vertically, we display the different weighting schemes, starting with the unweighted models at the top. In the second row, we have the kinematic weighting, which preferentially weights both estimates slightly higher and wider. This is due to the model-predicted velocity dispersions being lower than the spectroscopically observed velocity dispersion measured in H0LiCOW X. However, the velocity dispersion estimates are consistent across the HST and JWST models (see Fig. 7). The imaging weighting in the third row is far more constraining than the kinematics for this system, and it indicates that the best-fitting models tend to be on the lower end of the models tested. This holds for both HST and JWST results. The estimate recovered by our best-fit models is ∼3.1% higher, most likely due to tighter constraints on the satellite’s mass provided by the NIRCam imaging. The last row combines both kinematics and imaging weights for the final estimate, with a 22% increase in precision compared to HST imaging.
Current usage metrics show cumulative count of Article Views (full-text article views including HTML views, PDF and ePub downloads, according to the available data) and Abstracts Views on Vision4Press platform.
Data correspond to usage on the plateform after 2015. The current usage metrics is available 48-96 hours after online publication and is updated daily on week days.
Initial download of the metrics may take a while.