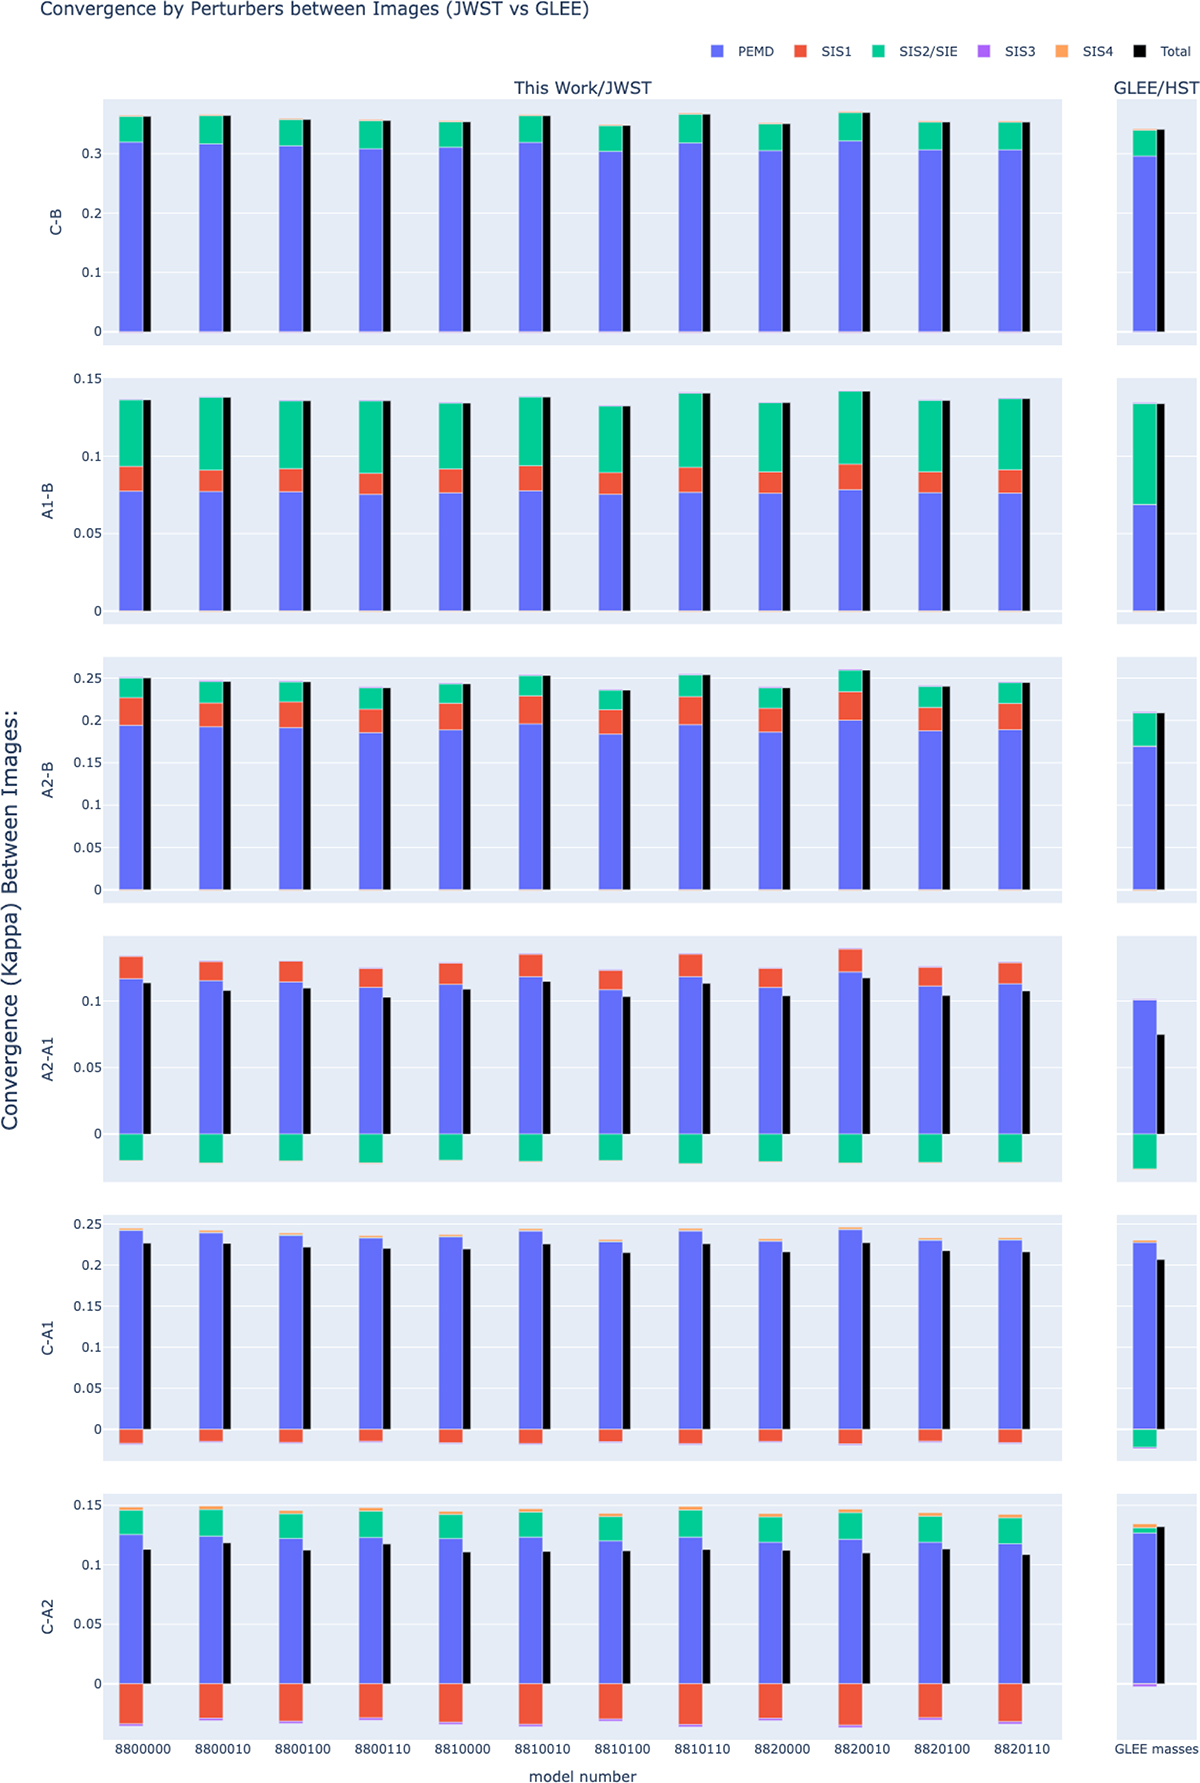
Fig. B.1.
Download original image
Differences in convergence between an image pair (vertical), broken down by each perturber. We compare each of our models (horizontal) with non-zero weight (left) to the HST results (right). Convergence difference from the main deflector is shown in blue, satellite X in red, nearby galaxy G2 in green, and the two farther perturbing galaxies G3 in purple and G7 in gold. We note that adding up the contributions from our models’ spherical G2 and satellite X (green + red) almost perfectly matches the HST contributions from G2 alone (green). This supports our claim that the HST model’s SIE profile for G2 is able to compensate for the missing satellite X, with the consequence of having an unphysical ellipticity and shifts in other model parameters.
Current usage metrics show cumulative count of Article Views (full-text article views including HTML views, PDF and ePub downloads, according to the available data) and Abstracts Views on Vision4Press platform.
Data correspond to usage on the plateform after 2015. The current usage metrics is available 48-96 hours after online publication and is updated daily on week days.
Initial download of the metrics may take a while.