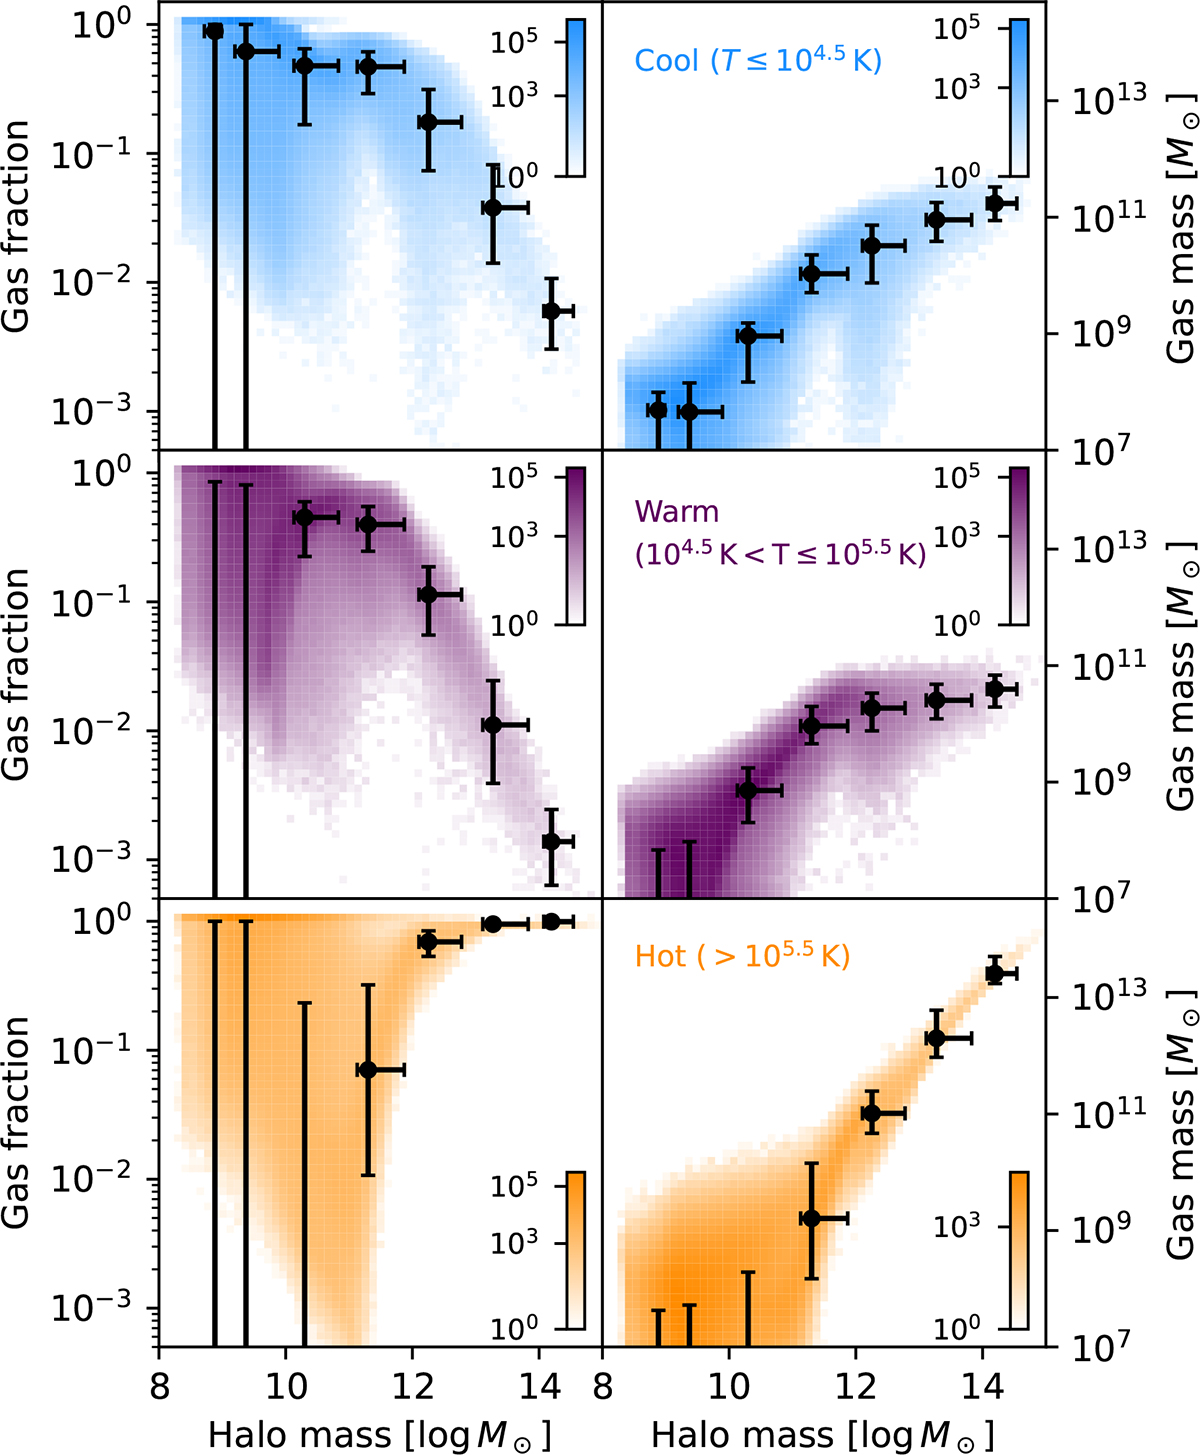
Fig. 1.
Download original image
Fraction of each gas phase relative to the total gas mass (left) and the absolute gas mass for each phase (right) as functions of halo mass (x-axis) across all halos and clusters of TNG300 at z = 0. We divide gas into cool (first row, blue), warm (second row, purple), and hot (third row, orange) components. The color intensity indicates the number of halos per pixel. The black markers are the median in both gas fraction or gas mass and halo mass for mass bins of width 1 dex from 108 to 1015 M⊙. The error bars denote the 16th and 84th percentile along both axes. More massive clusters host larger amounts of cool gas within their FoF halos, even though fractionally the contribution of cool and warm gas to clusters decreases with total mass.
Current usage metrics show cumulative count of Article Views (full-text article views including HTML views, PDF and ePub downloads, according to the available data) and Abstracts Views on Vision4Press platform.
Data correspond to usage on the plateform after 2015. The current usage metrics is available 48-96 hours after online publication and is updated daily on week days.
Initial download of the metrics may take a while.