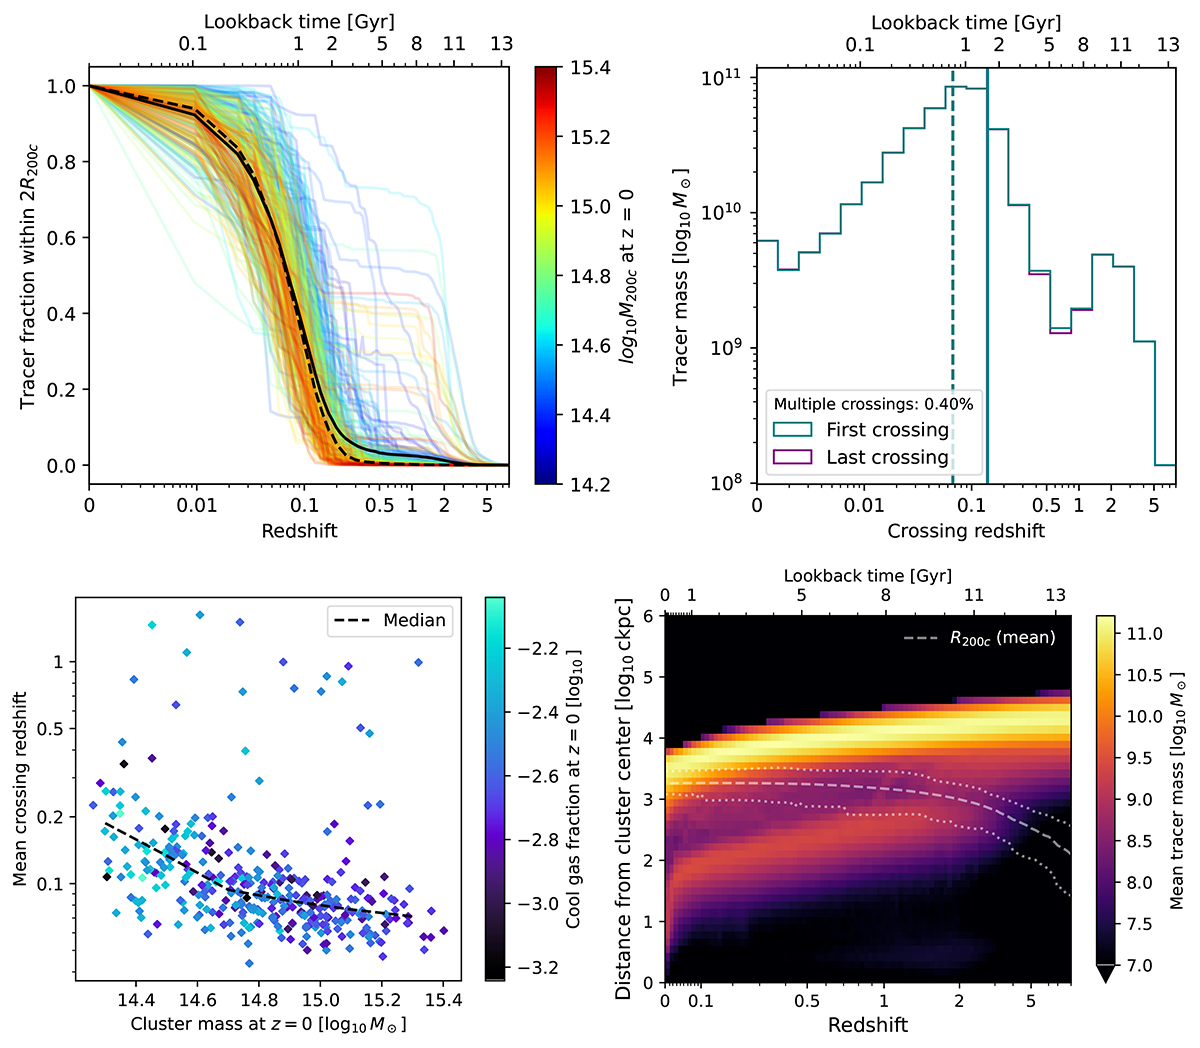
Fig. 10.
Download original image
Evolution of the spatial distribution of tracers that contribute to z = 0 cool gas in clusters, from TNG-Cluster. In practice, here we follow those tracers that at z = 0 are associated with gas cells of temperatures below 104.5 K and within 2R200c of their host cluster. Top left: Fraction of selected tracers within 2R200c as a function of redshift. The virial radius R200c develops with redshift and is that of the cluster progenitor which eventually hosts the cool gas at redshift z = 0. Top right: Mean distribution of crossing redshifts, defined as the first (green) or last (purple) redshift at which the distance from a tracer to the progenitor of its z = 0 host cluster decreases below 2R200c. The solid (dashed) vertical line shows the mean (median) crossing redshift. Bottom left: Mean 2R200c crossing redshift of every cluster in TNG-Cluster versus the z = 0 mass of the cluster. The individual points are colored by the cluster cool gas mass fraction at z = 0, while the black dashed line shows the median trend. Bottom right: Marginalized distribution of distances of tracers as a function of redshift. Color indicates the bin-wise mean tracer mass, per bin per cluster. The dashed white line shows the mean virial radius of the cluster sample, and the two dashed white lines show the minimum and maximum virial radius of the sample in each redshift bin. Clusters gather most of the gas that eventually forms redshift z = 0 cool gas around z ∼ 0.1.
Current usage metrics show cumulative count of Article Views (full-text article views including HTML views, PDF and ePub downloads, according to the available data) and Abstracts Views on Vision4Press platform.
Data correspond to usage on the plateform after 2015. The current usage metrics is available 48-96 hours after online publication and is updated daily on week days.
Initial download of the metrics may take a while.