Fig. 11.
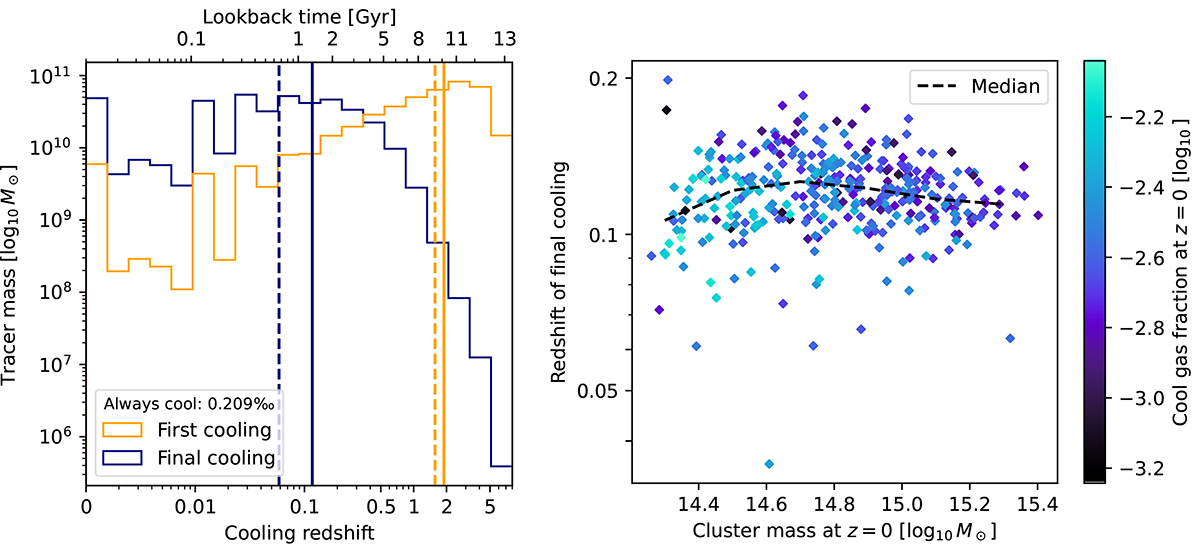
Download original image
Cooling redshift for z = 0 cool gas in clusters. As in Figure 10, we use TNG-Cluster and the tracers that contribute to z = 0 cool gas. Left: Mean distribution of cooling redshifts, defined as when gas associated with the selected tracers cools below the threshold value of 104.5 K for the first (orange) or last (blue) time. The solid (dashed) line marks the position of the mean (median) cooling redshift for each of the distributions. Right: mean redshift of final cooling per cluster as a function of halo mass at z = 0. Color denotes the cool gas fraction at redshift z = 0, while the black dashed line shows the median relation. The gas that eventually forms redshift z = 0 cool gas typically cools and heats up multiple times before cooling for the final time around z ∼ 0.1, potentially a signature of pre-processing in other halos.
Current usage metrics show cumulative count of Article Views (full-text article views including HTML views, PDF and ePub downloads, according to the available data) and Abstracts Views on Vision4Press platform.
Data correspond to usage on the plateform after 2015. The current usage metrics is available 48-96 hours after online publication and is updated daily on week days.
Initial download of the metrics may take a while.