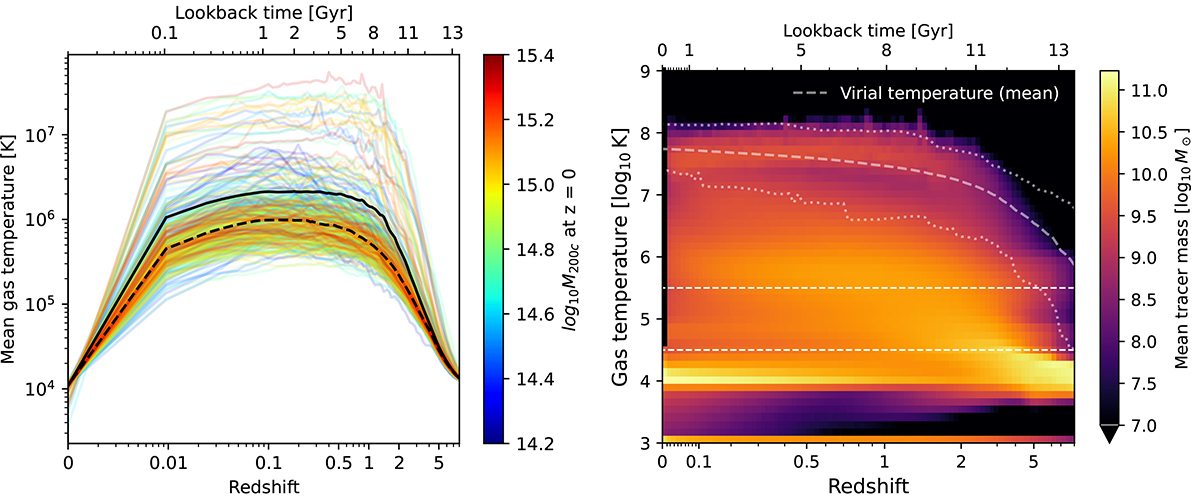
Fig. 12.
Download original image
Evolution of the temperature of tracers that contribute to z = 0 cool gas in clusters, from TNG-Cluster. Left panel: Mean temperature of gas cells associated with the cool gas tracers in each cluster as a function of redshift. Each halo of TNG-Cluster is shown as a single line, with color denoting the z = 0 cluster mass M200c. The black solid (dashed) line shows the mean (median) over the entire cluster sample. Right panel: Distribution of temperature for gas cells associated with the selected tracers with redshift, showing the bin-wise mean over the individual distributions of all clusters. The faint dashed white line shows the mean virial temperature of the cluster sample, and the two faint dashed white lines show the minimum and maximum virial radius of the sample in each redshift bin. The two straight dashed white lines show the division between the temperature regimes at 104.5 (below which we talk of cool gas) and 105.5 K (above which we talk of hot gas), respectively. The predecessor gas to redshift z = 0 cool gas on average spends most of the time since z = 8 at temperatures > 105 K, but below the virial temperature of the host cluster, and cooled only recently.
Current usage metrics show cumulative count of Article Views (full-text article views including HTML views, PDF and ePub downloads, according to the available data) and Abstracts Views on Vision4Press platform.
Data correspond to usage on the plateform after 2015. The current usage metrics is available 48-96 hours after online publication and is updated daily on week days.
Initial download of the metrics may take a while.