Fig. 15.
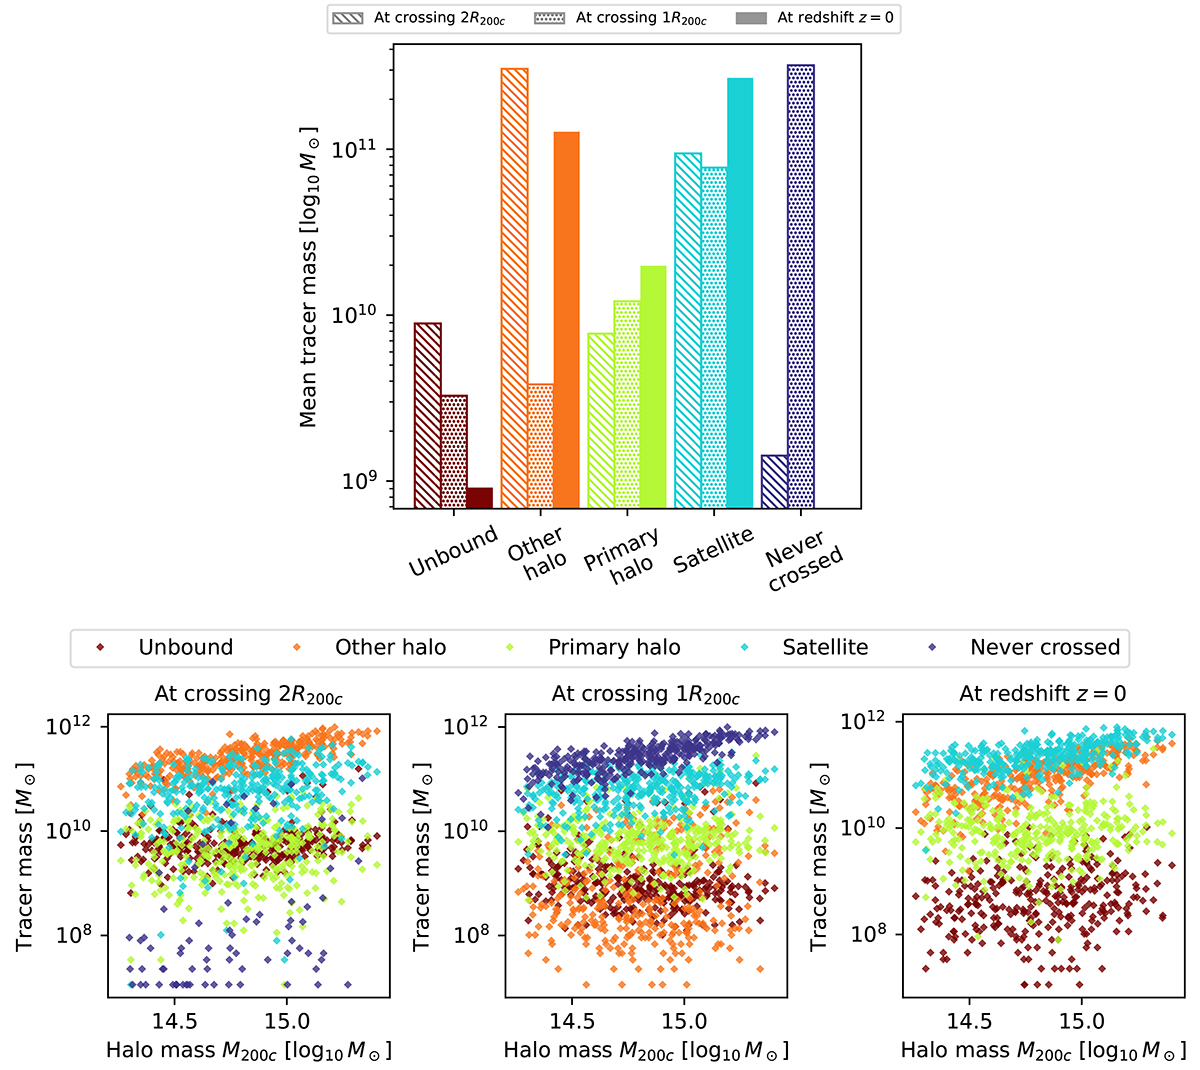
Download original image
Fractional mass of cool gas in clusters by origin. Top panel: Mean mass of tracers per cluster in each parent category for all TNG-Cluster clusters at time of crossing 2R200c (hatched), at crossing R200c (dotted), and at redshift z = 0 (solid). The parent categories are those defined in Section 2.2 and already characterized in Figures 13 and 14. The rightmost blue bars additionally show the total mass of tracers that never crossed the respective distance, either because they remained outside this distance for all redshifts between z = 8 and today, or because they have constantly been within this radius since z = 8. For the redshift zero category, no such tracer exists, since all tracers are by definition in one of the four parent categories. Since all tracers have the same mass of 1.2 × 10⁷ M⊙, the relative height of the bars gives the relative number of tracers as well. Bottom panel: Tracer mass in each origin category for individual clusters versus M200c of the respective cluster at z = 0. The colors and respective categories are identical to the top panel. Each cluster is associated with five markers, one for each category. The majority of redshift z = 0 cool gas predecessors is carried into the cluster 2R200c region by satellites and other halos, in which it predominantly also remains until today, while ∼80% of this gas never crosses the virial radius.
Current usage metrics show cumulative count of Article Views (full-text article views including HTML views, PDF and ePub downloads, according to the available data) and Abstracts Views on Vision4Press platform.
Data correspond to usage on the plateform after 2015. The current usage metrics is available 48-96 hours after online publication and is updated daily on week days.
Initial download of the metrics may take a while.