Fig. A.1.
Download original image
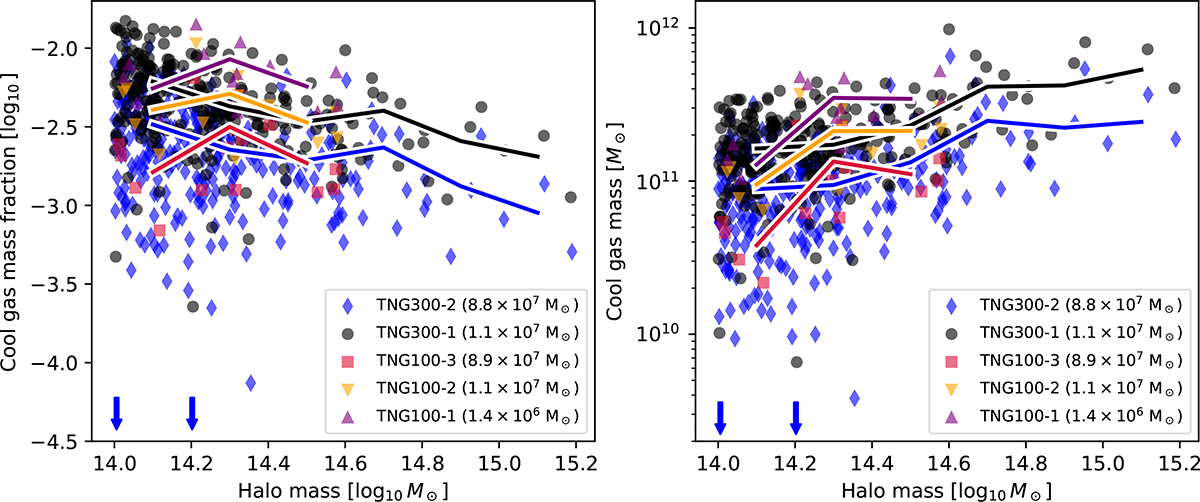
Effects of resolution on the cool gas mass fraction (left panel) and total cool gas mass (right panel) within 2R200c of clusters in various TNG runs. The markers represent individual clusters, with their shape and color denoting the simulation and respective resolution, and the solid lines showing the average in seven mass bins of 0.2 dex.
Current usage metrics show cumulative count of Article Views (full-text article views including HTML views, PDF and ePub downloads, according to the available data) and Abstracts Views on Vision4Press platform.
Data correspond to usage on the plateform after 2015. The current usage metrics is available 48-96 hours after online publication and is updated daily on week days.
Initial download of the metrics may take a while.