Fig. 2.
Download original image
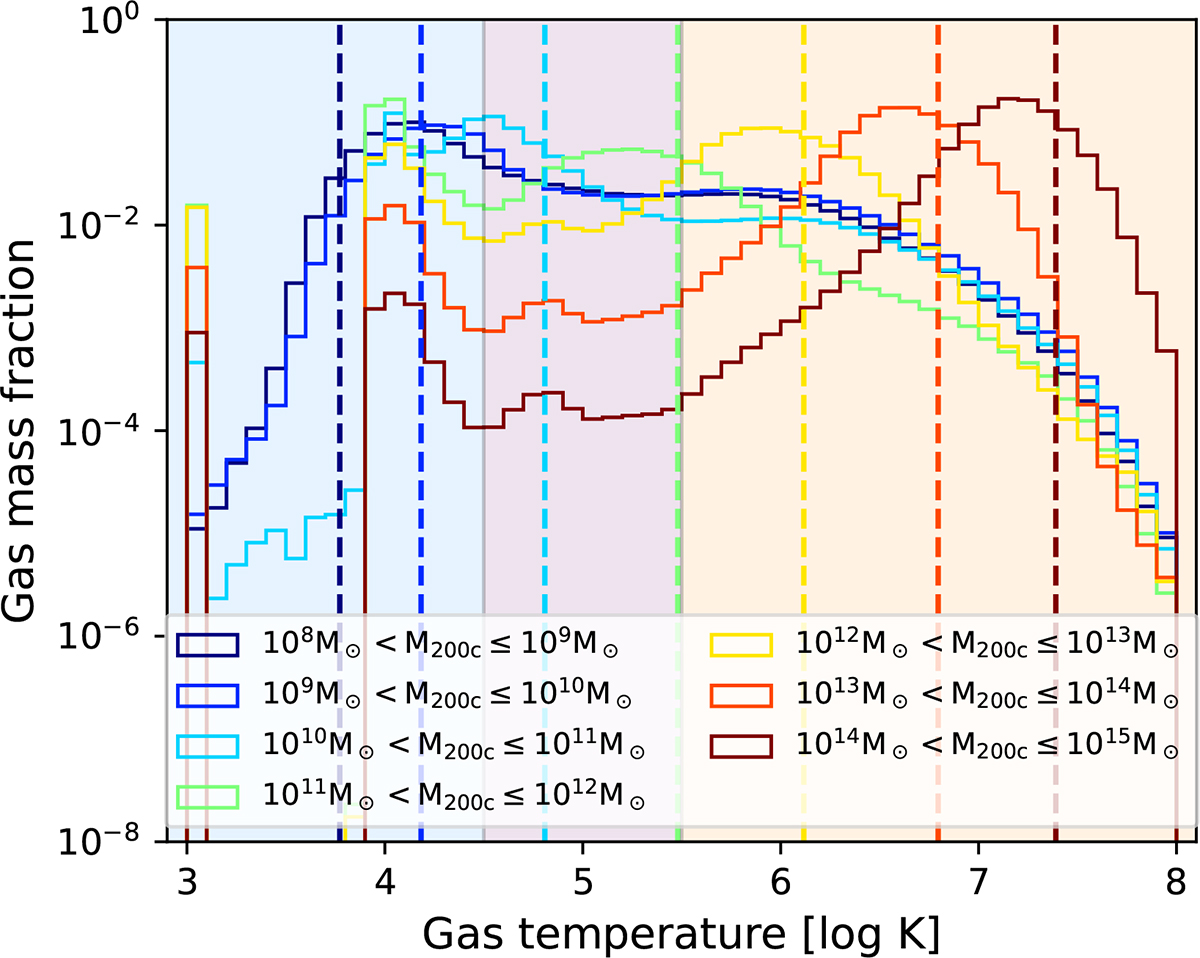
Temperature distributions of gas in halos of TNG300, from 108 to 1015 M⊙ in mass bins of width 1 dex. The dotted lines show the average virial temperature in the corresponding mass bin. The shaded regions show the temperature regimes in the same colors as Figure 1. Even for the very massive systems that are the focus of this paper (clusters with > 1014 M⊙, brown curve), a non negligible amount of cool gas resides within the ICM and cluster galaxies.
Current usage metrics show cumulative count of Article Views (full-text article views including HTML views, PDF and ePub downloads, according to the available data) and Abstracts Views on Vision4Press platform.
Data correspond to usage on the plateform after 2015. The current usage metrics is available 48-96 hours after online publication and is updated daily on week days.
Initial download of the metrics may take a while.